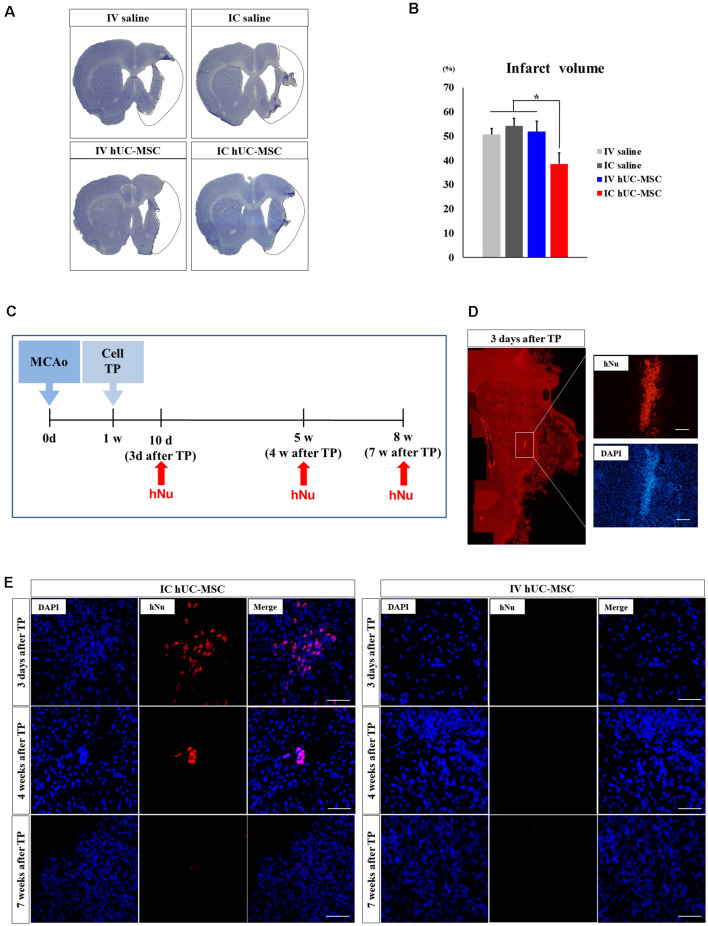
Figure 2.
Comparison of infarct volumes and cell survival times in brain tissue after IC transplantation or IV injection of hUC-MSCs. (A) Cresyl violet staining in four study groups 8 weeks after MCAo induction. Black dashed line denotes arbitrary outline of infarct (scale bar = 100 μm). (B) Quantitative analyses of infarct volumes in four study groups (n = 8 each), data expressed as mean ± SEM values. *p < 0.05. (C) Schematic diagram of in vivo cell survival experiment (MCAo, point of middle cerebral arterial occlusion; Cell TP, point of cell or saline delivery in MCAo rats; hNu, point of hNu IHC). (D,E) Representative images of immunohistochemistry (IHC) for hNu at 3 days, 4 weeks, and 7 weeks after cell delivery. Note: hNu+ cells detected at 3 days and 4 weeks after IC transplants of hUC-MSCs; no hNu+ cells were detected after IV injection of hUC-MSCs. DAPI (blue) counterstain. Scale bar = 50 μm.

