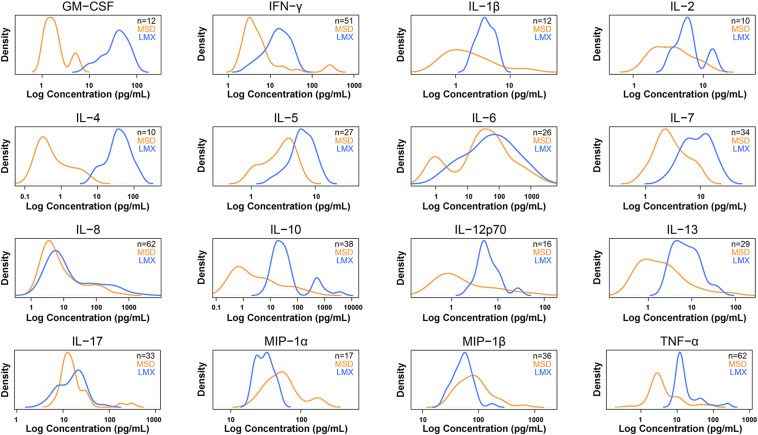
FIGURE 3.
Density plots for 16 cytokines measured in human plasma samples by both methods that were within each assay’s dynamic range. Density plots show the distribution of the measured sample concentrations using a kernel density estimation. Luminex (LMX) is shown in blue and Meso Scale Discovery (MSD) in orange. Concentrations (x-axis) are on log scale. Density (y-axis) is scaled so that the total area under the two curves is the same. These plots give an overview of how sample measurement compares between the two methods.

