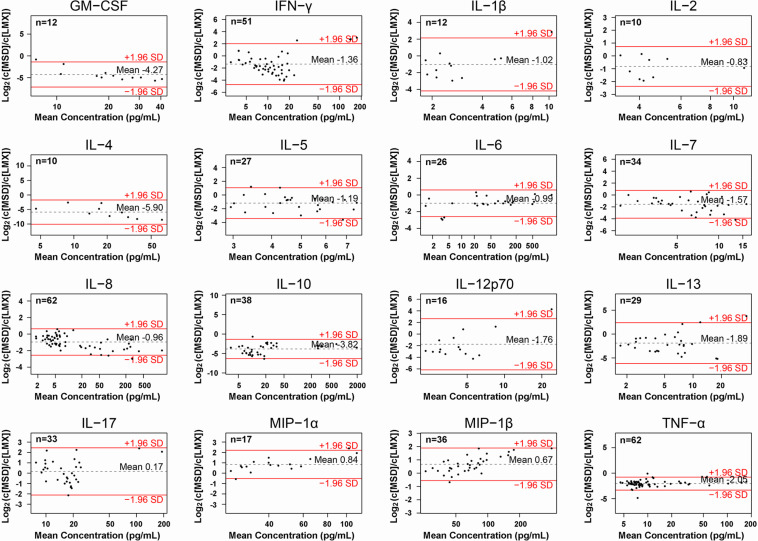
FIGURE 4.
Agreement analysis of concentrations of the 16 cytokines measured in human plasma samples by the Luminex (LMX) and Meso Scale Discovery (MSD) multiplex assays, to assess agreement between the two platforms. Log2 values of the MSD/LMX concentration ratios are shown on the y-axis, and provide a visual assessment of estimates of systematic differences in measurement between methods when the mean value deviates from 0. In this presentation, a negative shift in the mean indicates that the MSD assay classifies the analyte as concentrations lower than LMX, and vice versa. Mean analyte concentrations (in pg/mL) are shown on the logarithmic x-axis, and precise values appear above the dotted horizontal “mean” lines in each graph. The ±1.96 SD lines represent the 95% limits of agreement, and when SDs are large or n-values are low, then interpretation can be ambiguous. In general, for most shared analytes, the mean is shifted to a negative value, indicating that MSD quantified an analyte at a lower concentration than LMX did using the same samples. Exceptions appear to be MIP-1α and MIP-1β, where LMX on average characterizes samples at lower concentrations. An example of where LMX and MSD are comparable is IL-17, where the mean ratio is close to 0. Proportional bias is suggested in the case of MIP-1β, wherein the mean concentration ratio approximates 0 at lower measured concentrations, but increases toward +2 at higher analyte concentrations.

