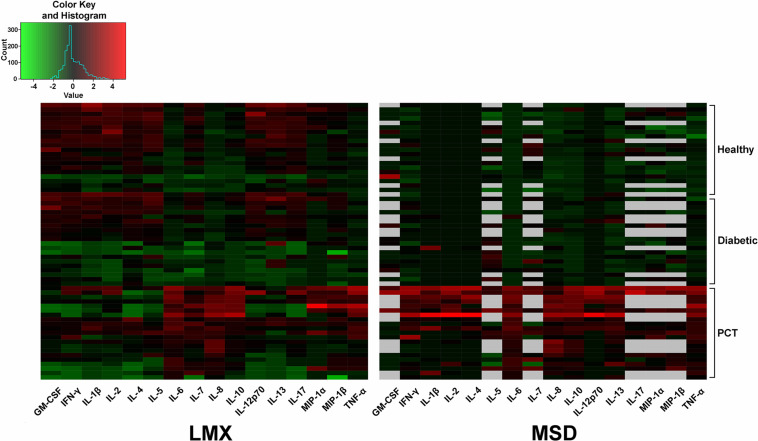
FIGURE 5.
Heatmap depiction of relative analyte concentrations measured by the Luminex (LMX) and Meso Scale Discovery (MSD) multiplex assays. Cytokine measurements were performed in plasma samples from healthy individuals and from people with diabetes or elevated procalcitonin (PCT) levels. Data were centered and scaled per analyte per method. A histogram showing the color key used to designate sample concentrations is provided to the top left of the main image. Each cell represents a single analyte in a single plasma sample. Black cells indicate cytokine levels in that sample that were measured to be the approximate mean of all evaluated samples. Red cells indicate higher (above average) measured cytokine values for that sample/assay combination and green cells indicate lower (below average) analyte concentrations, with color intensity indicating magnitude of difference. Gray cells mean that sample data for that specific analyte were not available. Analyzed samples that provided signals below the lower limit of quantification (LLoQ) for any analyte had those values artificially entered as their specific LLoQ value before calculation and mapping.

