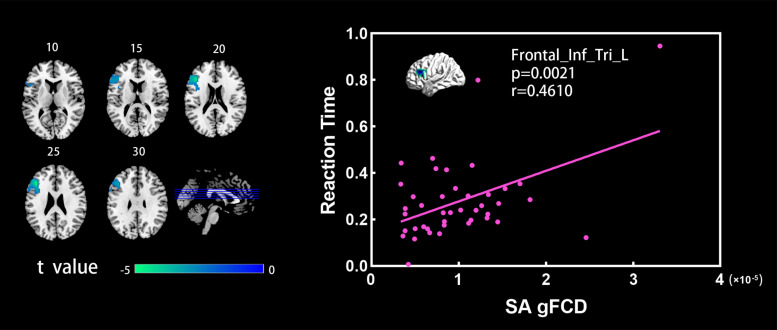
FIGURE 3.
(Left) Brain regions showing significant differences between the SA and NC groups in the gFCD analysis (two sample t-test, p < 0.05, GRF corrected). Numbers above each image refer to the z-plane coordinates of the MNI space. (Right) Significant correlation between reaction time and gFCD values in the SA group. Frontal_Inf_Tri_L, left triangular part of inferior frontal gyrus.

