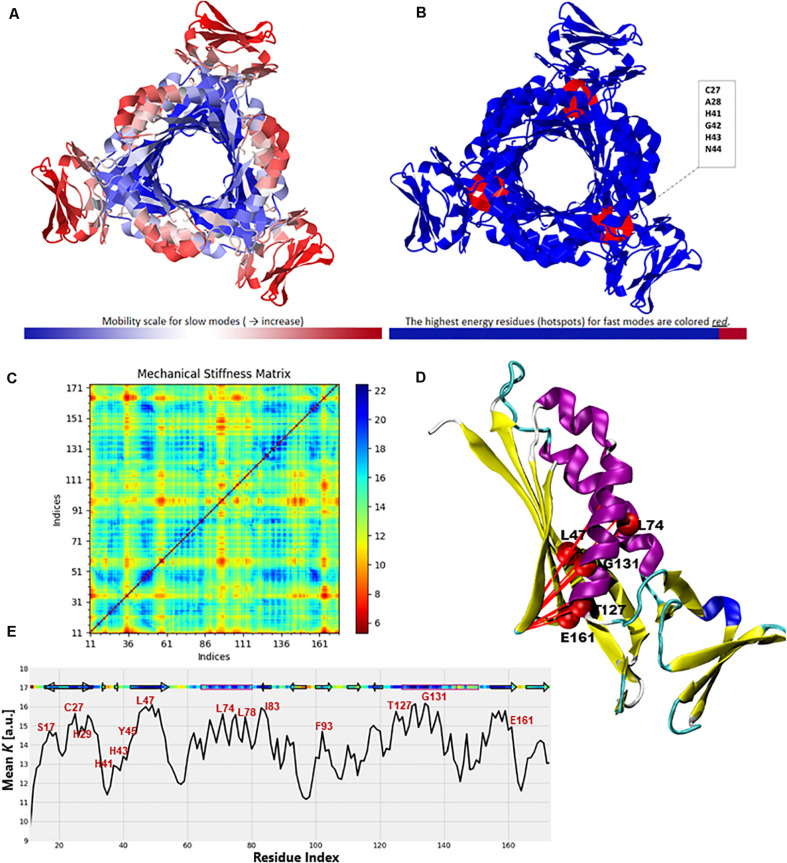
FIGURE 12.
Color-coded representation of the PTPS structure based on the mobility of the residues within the (A) Low-frequency and (B) High-frequency GNM modes. The color scale varies from blue as the most rigid to red as most mobile sites. The figures were obtained from the DynOmics portal (Li et al., 2017). (C) A mechanical resistance matrix obtained by calculating the effective force constant in response to uniaxial extensional forces exerted at each pair of residues. The scale varies from blue as residue pairs of the strongest interaction/rigid to red residue pairs of the weakest interaction/flexible. (D) A cartoon representation of a single chain of P. falciparum PTPS with the residues of strongest interaction mapped onto the structure and shown as red spheres. (E) The mean value of the effective spring constant over all pairs for each residue, with the secondary structures shown along the upper abscissa. The color bar shows strong regions/rigid in blue and weak regions/mobile in red. The figures were generated using the Matplotlib library and VMD.

