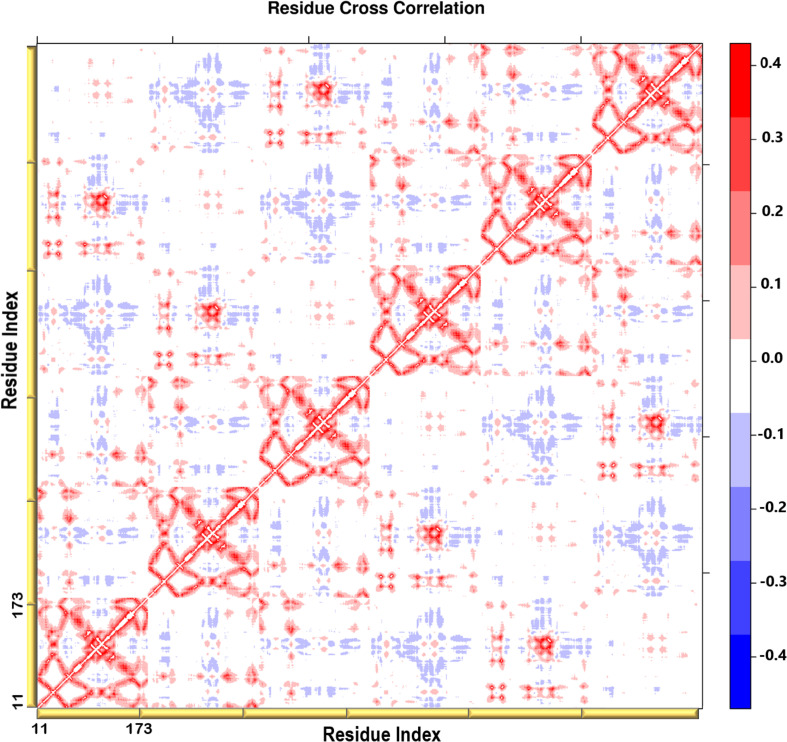
FIGURE 6.
A heatmap representation showing the Cβ atoms pairwise cross-correlation. The correlation matrix ranges from −0.4 to +0.4. The scale color bar on the right indicates the extent of the correlation in which the red color highlights correlated motions (residue pairs moving together in the same direction), while the blue color highlights the anti-correlated movements (residue pairs moving in opposite direction). The yellow bars along the bottom represent each chain of the protein.

