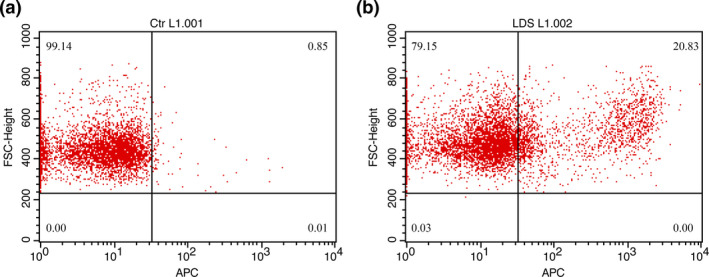
Figure 1.

FACS results for autologous PD‐L1 CAR‐T cells. (a) Non‐transduced T cells were used as control. (b) Transduced T cells. Both a and b were stained with biotinylated PD‐L1::human Fc fusion protein and APC‐labelled streptavidin. Approximately 20% of the transduced cells were CAR‐positive T cells.
