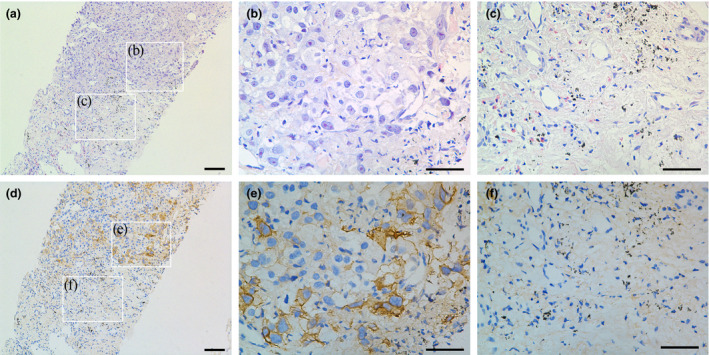
Figure 4.

Pathological examination of the patient’s lung tumor via core needle biopsy. (a) Representative section of H.E. staining showing adenocarcinoma. Scale bar: 100 µm. (b, c) High‐power observations of tumor and non‐tumor regions in a. Scale bar: 50 μm. (d) Corresponding section of IHC staining. (e, f) High‐power observations of PD‐L1 expression in tumor and non‐tumor regions in d. Tumor cells were positive for PD‐L1 expression, whereas the adjacent non‐malignant lung tissue was negative. Scale bar: 50 µm.
