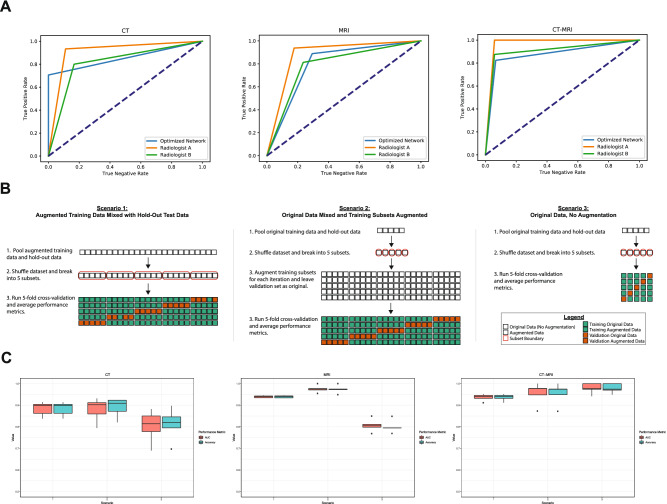
Figure 6.
Optimized network classification performance versus human specialist and 5-fold cross-validation evaluation. (A) Radiologist average auROC of 89.4%, 83.3%, and 93.8% for CT, MRI, and CT-MRI, respectively. GA-optimzed auROC of 85.3%, 83.3%, and 87.8% for CT, MRI, and CT-MRI, respectively. (B) Schematics of 5-fold cross-validation (5F-CV) approaches used to verify the perceived improvement yielded by augmented training data (scenario 3 vs. scenarios 1 and 2). Additionally scenarios 1 and 2 investigate the effect of mixing augmented data into the overall data pool versus only augmenting training data. (C) Performance metrics (AUC: area under the ROC curve; Accuracy: standard accuracy metric) for 5F-CV across all three scenarios. Peak performance was achieved via scenario 2 in CT (AUC = 88.0%, Accuracy = 89.0%) and MRI (AUC = 97.5%, Accuracy = 97.4%). In the context of CT-MRI, peak performance was attained in scenario 3 (AUC = 97.8%, Accuracy = 97.9%).

