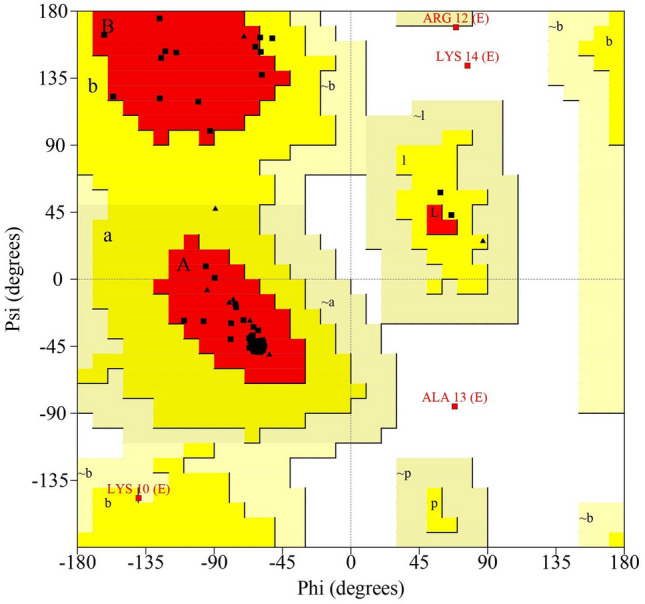
Fig. 7.

Ramachandran plot analysis of phi-psi graph for the predicted 3D structure of Hw-Hip as computed by PROCHECK program. The areas A, B and L represent the most favoured region, whereas a, b, l and p mark the additional allowed regions. The ~ a, ~ b, ~ l and ~ p areas designate generously allowed regions. The area that does not fall to any of these categories is considered as disallowed region
