Figure 1.
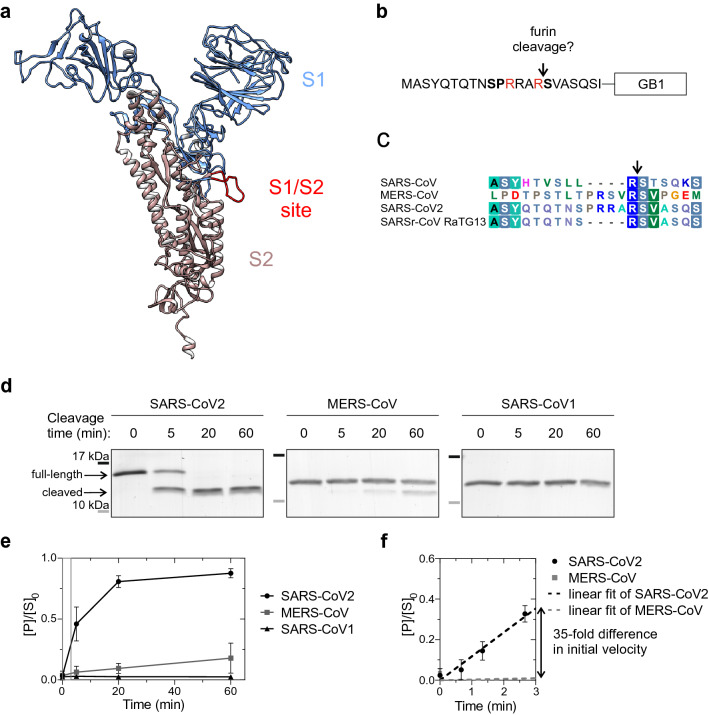
An insertion to the S1/S2 proteolytic cleavage site of SARS-CoV2 Spike protein introduces a furin site. (a) A structural model of SARS-CoV2 Spike protein15. Spike protein S1 (residue 1–685) is colored blue, Spike protein S2 (residue 686–1273) is colored brown and the intrinsically disordered S1/S2 proteolytic cleavage site is shown in red. The structure lacks the C-terminal residues 1148–1273. (b) Scheme of the constructs used to examine furin specificity. A 20-residue segment around the S1/S2 site was fused with a linker ELQGGGGG to the Streptococcal protein G B1 domain (GB1) and a C-terminal 6xHis tag. (c) Sequence alignment of the S1/S2 region in SARS-CoV, MERS-CoV, SARS-CoV2, and bat virus SARSr-CoV RaTG13, which is closely related to SARS-CoV216. (d) Coomassie-stained SDS-PAGE gels showing the proteolytic cleavage of the GB1-fused reporter constructs. Furin activity towards the S1/S2 region of SARS-CoV2, MERS-CoV, and SARS-CoV1 was measured in vitro using the GB1 reporter constructs shown in ‘b’. The MW of SARS-CoV2 GB1 reporter protein is 10.9 kDa, which is cleaved by furin to 9.2 kDa and 1.7 kDa fragments. Uncropped images are shown in Supplementary Fig. S1. (e) Quantified data from the furin cleavage assay. The plot shows the relative amount of cleaved product compared to amount of uncleaved substrate at t = 0 min. Error bars show standard deviation. (f) Comparison of initial velocities of furin cleavage of SARS-CoV2 and MERS-CoV S1/S2 reporter constructs. To determine the initial velocity of SARS-CoV2 S1/S2 cleavage, the reaction was stopped at early time points (40 s, 1 min 20 s and 2 min 40 s) and these were used for the linear regression.

