Figure 2.

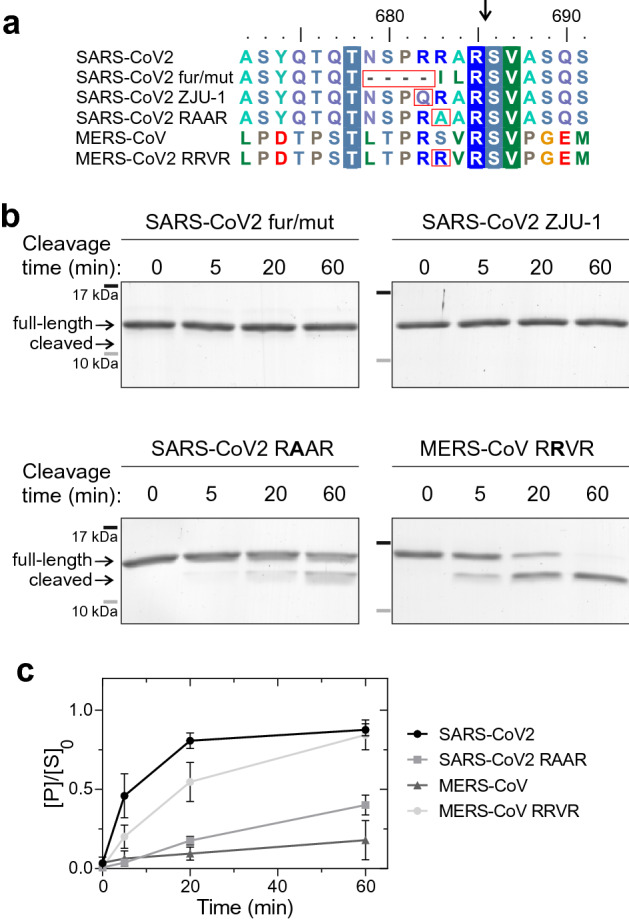
Analysis of furin cleavage efficiency of different SARS-CoV2 and MERS-CoV S1/S2 cleavage site mutants. (a) Alignment of SARS-CoV2 and MERS-CoV S1/S2 regions with the mutants used in substrate constructs for analysis of furin cleavage specificity in panel ’b’. (b) The furin cleavage efficiency of different mutants was analyzed in an in vitro time-course experiment. The proteolytic cleavage of S1/S2-GB1 reporter constructs by furin is visualized by Coomassie staining of SDS-PAGE gels. Uncropped images are shown in Supplementary Fig. S1. (c) The plot shows the accumulation of cleaved S1/S2-GB1 reporter protein in an in vitro furin activity assay. The error bars show standard deviation.
