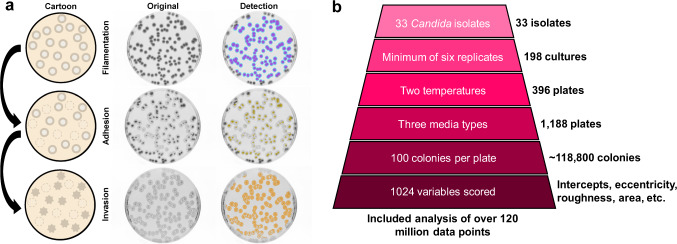
Fig. 1. Experimental approach for determining biofilm-related phenotypes.
a One hundred cells from each strain were plated, allowed to grow for seven days, and the resulting colonies were imaged for filamentation (radial in cyan and center colony wrinkling in magenta). Plates were then rinsed with a stream of water and imaged for adhesion (yellow). Remaining colonies were wiped off and the plates imaged for agar invasion (orange). A cartoon, raw image, and detection overlay (left to right) has been shown to highlight this process. b Automated quantification facilitated measurement of ~118,800 colonies to collect over 120,000,000 data points (C. albicans – ~85 million, non-albicans Candida species – ~35 million) for analysis of filamentation, wrinkling, adhesion, and invasion.

