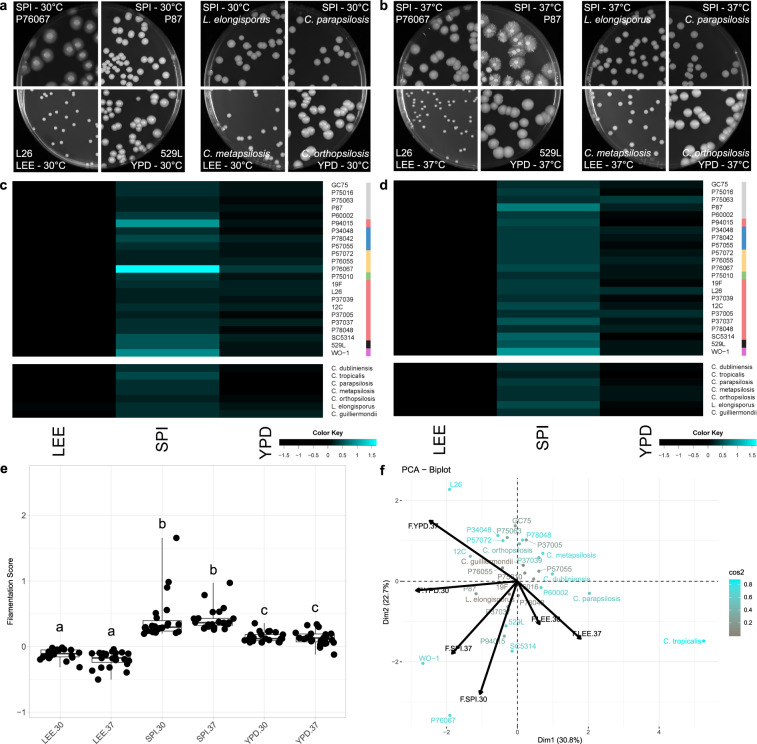
Fig. 2. Candida radial filamentation is largely defined by medium.
Plate images of C. albicans isolates (left) and non-albicans Candida species (NACS) (right) highlight the varied radial filamentation profiles across media at 30 °C (a) and 37 °C (b). Heatmaps represent the degree of radial filamentation for Candida isolates at 30 °C (c) and 37 °C (d). Scoring for radial filamentation was defined by (areahyphal growth − areacenter colonies)/(areacenter colonies) for at least six biological replicates and averaged. Isolate clade is color coded on the right as in Hirakawa et al.37. e Radial filamentation scores for each C. albicans isolate were grouped and plotted for each media and temperature combination. Overlaid box plots cover the upper and lower interquartile ranges with the intervening line indicating the mean. Whiskers extend to the extreme datapoints. Letters indicate statistically different groups based on Bonferroni-corrected p < 0.05 by Dunn’s test. f PCA biplots were constructed using radial filamentation data for all assayed Candida isolates. Coloration from gray to cyan represents the power of the strain in defining PC1 and PC2. Black arrows represent vectorized phenotypic contributions where the arrows are labeled (Phenotype.Media.Temperature). LEE = Lee’s medium, SPI = Spider medium, YPD = Yeast Peptone Dextrose medium.

