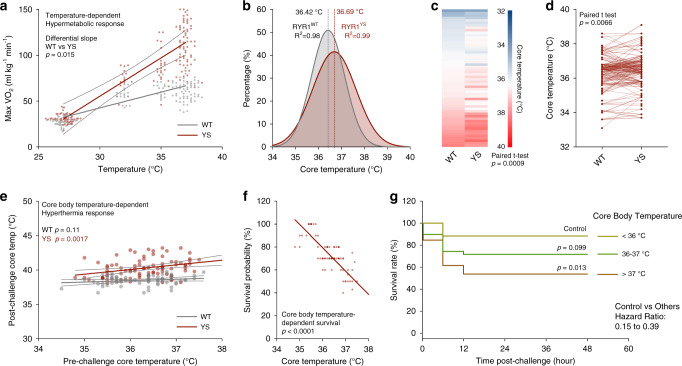
Fig. 2. Enhanced heat sensitivity and elevated core body temperature in Y524S mice.
a Maximum oxygen consumption rate (maxVO2) of WT (n = 92) and YS (n = 115) mice during heat challenge at the indicated temperatures. b Distribution of baseline core body temperature of WT (n = 175) and YS (n = 202) mice at room temperature. c, d Comparison of baseline core body temperatures of WT and YS mice in littermate pairs analyzed per litter (c n = 56 pairs) and per individual animals (d n = 177 pairs). e Relationship of baseline core body temperature and hyperthermia response after acute 37 °C heat challenge in WT (n = 66) and YS (n = 85) mice. f Effect of baseline core body temperature on the estimated survival probability of YS mice (n = 85) after acute heat challenge. g Kaplan–Meier analysis of the heat challenge survival rate of YS mice (n = 85) grouped by baseline core body temperature. All mice were housed at room ambient temperature (20.2 ± 0.4 °C) prior to heat challenge. All mice were within the controlled age range (8.9 ± 0.9 week old) at the time of study. P values are indicated as analyzed by F-test for differential slope of linear regressions (a), paired t test (c, d), F-test for deviation from zero-slope of linear regression (e, f), and Mantel–Cox log-rank test (g). All statistical tests are two-sided. R2 values are indicated to quantify goodness-of-fit to Gaussian distribution (b). Survival probability of each mouse is estimated based on the survival rate from ten mice in the respective core body temperature (f) subgroups. Data are represented as asymmetrical 95% confidence intervals (CI) from linear best-fit line (a, e). Source data are provided as a source data file.

