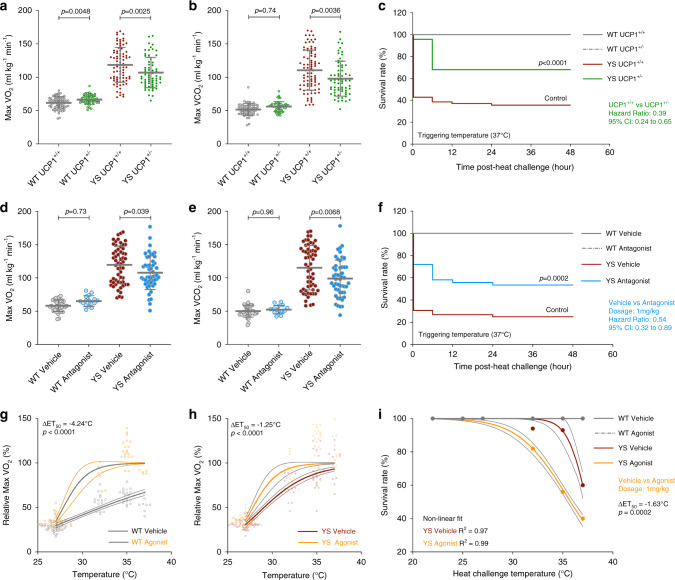
Fig. 4. Pharmacological and genetic modulation of adipose tissue thermogenic activity alters heat sensitivity of Y524S mice.
a, b MaxVO2 (a) and maxVCO2 (b) of WT (n = 108) and YS (n = 146) mice with or without heterozygous genetic ablation of the mitochondrial uncoupling protein (Ucp1WT/null) during acute heat challenge at 37 °C. c Kaplan–Meier analysis of the survival rate of WT (n = 108) and YS mice (n = 146) with or without Ucp1-ablation (heterozygous) after acute heat challenge. d, e Maximal O2 consumption (maxVO2, d) and CO2 production (maxVCO2, e) rate of WT (n = 53) and YS (n = 108) mice pretreated with β3-adrenergic receptor (β3AR) antagonist (L748337, 1 mg/kg) or vehicle control during acute heat challenge at 37 °C. f Kaplan–Meier analysis of the survival rate of WT (n = 53) and YS mice (n = 108) pretreated with β3AR antagonist or vehicle control after acute heat challenge. g, h Heat sensitivity of WT mice (n = 76, g) and YS mice (n = 106, h) pretreated with β3AR agonist (BRL37344, 1 mg/kg) or vehicle control as measured by half-maximal effective temperature (ET50) on O2 consumption rate for mice during acute exposure to various temperatures. i Effect of β3AR agonist on heat sensitivity of YS mice (n = 106) as measured by ET50 on survival rate of mice after acute exposures. All mice were within the controlled age range (8.8 ± 1.0 week old) at the time of study. P values are indicated as analyzed by ordinary one-way analysis of variance (ANOVA) with Tukey’s multiple comparisons test (a, b, d, e), and Mantel–Cox log-rank test (c, f), and F-test for differential ET50 of nonlinear regression with variable slope (g–i). Effects on heat sensitivity alteration in mice are established by comparing littermates of the same genotype with or without the genetic (a–c) or pharmacological (d–i) interventions. All statistical tests are two-sided. Data are represented as mean ± standard deviation (a, b, d, e), or asymmetrical 95% confidence non-linear best-fit curve (g–i). Source data are provided as a source data file.

