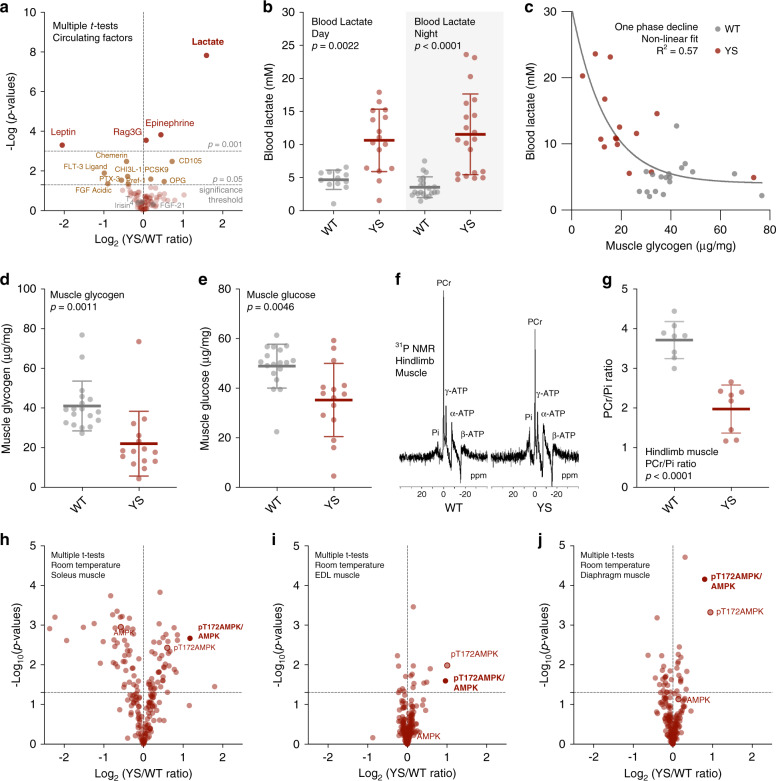
Fig. 6. Increased circulating levels of skeletal muscle-derived lactate in the Y524S mice.
a Volcano plot comparing the levels of circulating factors in WT (n = 4) and YS (n = 4) littermates. b Blood lactate concentration of WT and YS littermates as measured in filtered serum collected during day (WT n = 12, YS n = 16) and night (WT n = 20, YS n = 20) time. c Relationship of gastrocnemius muscle glycogen and blood lactate levels in WT (n = 18) and YS (n = 15) mice. d, e Muscle glycogen (d) and glucose (e) concentration as measured in gastrocnemius muscle isolated from WT (n = 18) and YS (n = 15) littermates. f Representative 31P nuclear magnetic resonance (NMR) spectra of hindlimb muscles measured in vivo from WT and YS littermate. g Quantification of phosphocreatine to inorganic phosphate ratio (PCr/Pi) based on analysis of the 31P NMR spectra from WT (n = 8) and YS (n = 8) hindlimb muscles. h–j Volcano plot comparing the level of proteomic changes in soleus (h), EDL (i), and diaphragm (j) muscle of WT (n = 3) and YS (n = 3) littermates. P values are indicated as analyzed by two-side unpaired t test without adjustment for multiple comparisons (a, h–j), ordinary one-way analysis of variance (ANOVA) with Tukey’s multiple comparisons test (b), and Welch’s t test (d, e, g). All statistical tests are two-sided. R2 values are indicated to quantify goodness-of-fit to nonlinear regression with variable slope (c). Data are represented as mean ± standard deviation (b, d, e, g). Mice were within the controlled age range (10.0 ± 1.8 week old) at the time of study. Source data are provided as a source data file.

