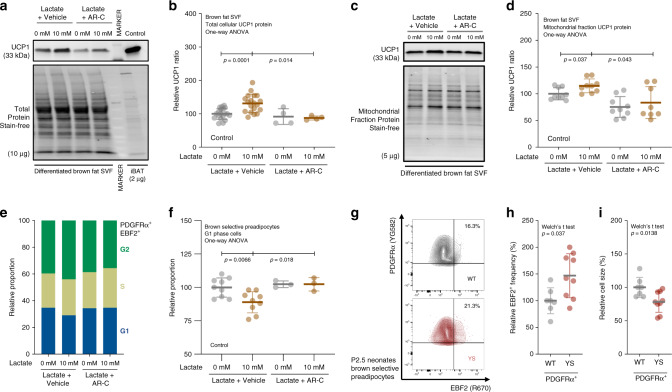
Fig. 7. Lactate promotes brown adipogenesis in brown preadipocytes.
a, b Representative immunoblots (a) and relative protein levels (b) for mitochondrial uncoupling protein (UCP1) in differentiation assay of interscapular brown adipose tissue (iBAT) stromal–vascular fraction (SVF) cells treated with vehicle control (n = 19), lactate (n = 19), monocarboxylate transporter (MCT1/2) inhibitor (n = 4) or both (n = 4). c, d Representative immunoblots (c) and relative protein levels (d) for UCP1 in mitochondrial fraction of differentiated iBAT SVF cells treated with vehicle (n = 9), lactate (n = 9), MCT1/2 inhibitor (n = 9) or both (n = 8). One data point (Lactate + ARC = 182.6% of control) identified as a statistical outlier (more than 2.04σ above the group mean) was excluded from the analysis based on the Grubb’s method. e, f Representative cell cycle distributions (e) and relative proportions (f) of G1 phase brown-selective preadipocytes in proliferation assay of iBAT SVF cells treated with vehicle (n = 9), lactate (n = 9), MCT1/2 inhibitor (n = 3) or both (n = 3). g Representative contour plots of platelet-derived growth factor receptor α-positive (PDGFRα+) preadipocytes in primary iBAT SVF cells isolated from P2.5 neonates of WT and YS littermate. h, i Relative early B cell factor-2-positive (EBF2+) frequency (h) and relative cell size (forward scatter, i) in PDGFRα+ preadipocytes in primary iBAT SVF cells from P2.5 neonates of WT (n = 7) and YS (n = 9) littermates. P values are indicated as analyzed by ordinary one-way analysis of variance (ANOVA) with Dunnett’s multiple comparisons test (b, d, f), and Welch’s t test (h, i). All statistical tests are two-sided. Data are represented as mean ± standard deviation. Relative protein levels are determined as protein levels normalized to vehicle (b, d, f) treated controls. Relative proportions are determined as proportions normalized to the level of wild-type littermate controls (h, i). Source data are provided as a source data file.

