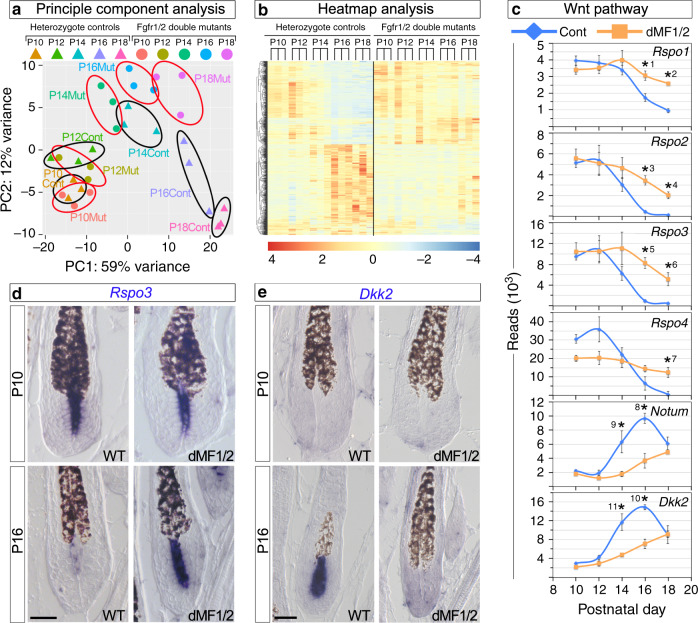
Fig. 3. Abrogation of Fgf signaling in the DP results in altered expression of Wnt agonists and antagonists.
a PCA analysis. Each colored triangle or dot represents the DP transcriptome of a single control or mutant mouse, respectively. Black and red circles demarcate control and mutant mice at a given time point, respectively. n = 3 mice per genotype per time point. b Heatmap analysis. Two classes of genes were revealed based on their expression pattern: genes whose expression during anagen gradually accumulate in control mice while remains low in the mutant and genes whose expression is progressively reduced in the control while persists at higher levels in mutant mice. c Graphic representation of the sequence reads of the RNA-seq analysis for Wnt agonists (Rspo1–4) and antagonists (Notum and Dkk2). Note the different scales of the reads. Data are mean ± SEM. Two-sided modified t-test adjusted for multiple comparisons using the Benjamin–Hochberg correction was employed. *1 Padj = 0.001, *2 Padj = 7.14E − 11, *3 Padj = 3.26E − 08, *4 Padj = 3.18E − 57, *5 Padj = 3.48E − 24, *6 Padj = 4.91E − 26, *7 Padj = 4.05E − 38, *8 Padj = 0.0003, *9 Padj = 0.02, *10 Padj = 3.2E − 06, *11 Padj = 4.14E − 07. n = 3 mice per genotype per time point. d, e In situ hybridization of Rspo3 and Dkk2 at P10 and P16 is shown to illustrate the specific and dynamic expression of these genes in the DP and their altered expression in the mutant. RNA transcripts are in dark blue and pigmented hair shafts in black. n > 5 mice per genotype per time point. Scale bar, 25 μm.

