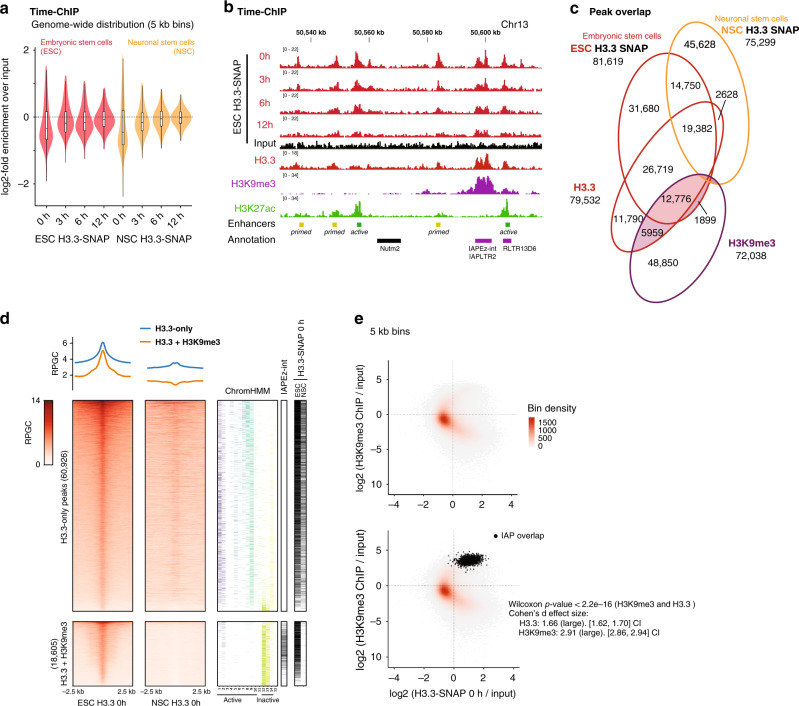
Fig. 1. Ectopic H3.3-SNAP shows ESC-specific enrichment at interstitial heterochromatin.
a Violin plots showing genome-wide distribution of biotin-labeled H3.3-SNAP9 in 5 kb windows, in mouse embryonic stem cells (ESC) and neuronal stem cells (NSC). Biotin labeling of H3.3-SNAP was performed at 0 h and followed over subsequent 3, 6, and 12 h9. Each datapoint is calculated as the log2 value of the mean coverage in each sample bin divided by the mean coverage value of its corresponding input sample bin. Data shown from n = 1 biological replicate. Source data are provided as a Source data file. b Genome tracks showing example region of time-ChIP9 in ESC showing overlap of H3.3-SNAP and endogenous H3.321 with H3K27ac20 at enhancers and H3K9me371 at IAP ERVs. All tracks were normalized to Reads Per Genomic Content (RPGC). See also Supplementary Fig. 1 for controls and additional tracks. c Venn diagrams showing overlap of H3.3-SNAP 0 h9 peaks with endogenous H3.3 peaks in ESC21, H3K9me371, and H3.3-SNAP 0 h peaks in NSC9. d Read density heatmaps and average profiles of H3.3-SNAP in ESC and NSC, at ESC H3.3 peaks21. Peaks were separated in two categories, H3.3-only and H3.3 + H3K9me3, according to coincidence with H3K9me3 peaks21. Overlap with 15 ChromHMM states37, IAP ERV elements (from RepeatMasker) and H3.3-SNAP peaks in ESC and NSC is shown as additional heatmaps where the coincidence with a chromatin state or peak from the respective annotation set is indicated with a colored or black line. e Scatter plot showing relationship between H3.321 and H3K9me371 assessed over 5 kb bins genome-wide. Color scale represents density of underlying data points (5 kb bins). Bottom graph shows bins overlapping with IAP ERVs in black. Two-sided Wilcoxon rank sum (p < 2.2e−16) and Cohen’s effect size d (H3.3: 1.66 +/−0.04; H3K9me3: 2.91 ± 0.05) tests show significant enrichment for both at H3.3 and H3K9me3 in these 5 kb bins. Overlap with additional repeat families are shown in Supplementary Fig. 3. Source data are provided as a Source data file.

