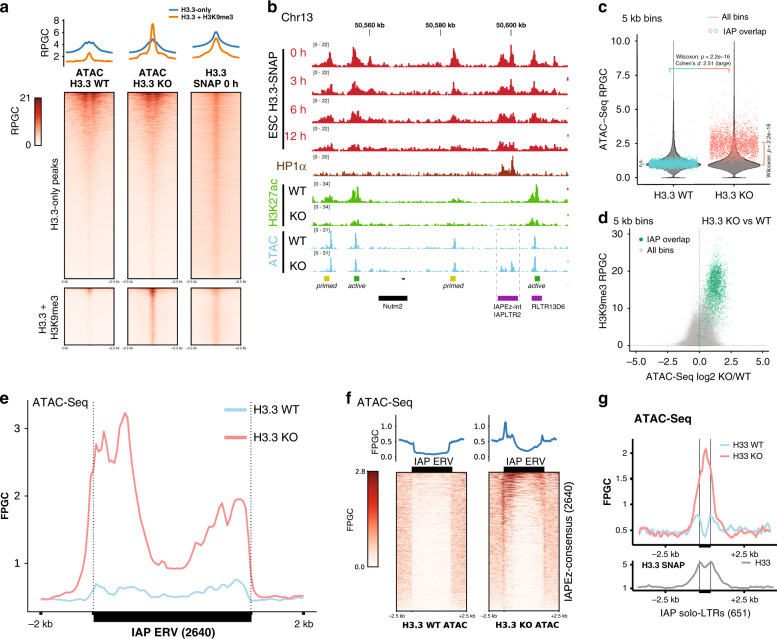
Fig. 3. Interstitial heterochromatin becomes accessible in the absence of H3.3.
a Read density heatmaps and average profiles of H3.3-SNAP time-ChIP9 and ATAC-Seq20 over two classes of H3.3 peaks, H3.3-only and H3.3 + H3K9me3 peaks. See Supplementary Figs. 7 and 8 for additional analysis. b Genome tracks showing H3.3-SNAP time-ChIP9, H3K27ac20, and ATAC-Seq20 signal over example region on Chr13. All tracks are normalized to Reads Per Genomic Content (RPGC). Source data are provided as a Source Data file. c Violin plots showing genome-wide distribution of ATAC-Seq signal in 5 kb bins, in H3.3 wildtype (WT) and knockout (KO) cell lines. Overlayed in color are 2797 individual bins overlapping with 2640 shared IAP ERVs. Two-sided Wilcoxon rank test (p < 2.2e-16) and large Cohen’s effect size (d = 2.51 ± 0.07) show significant increase in accessibility for IAP ERV containing bins in H3.3 KO. Genome-wide comparison between H3.3 WT and KO shows a significant (p = 6.4e-14) difference but negligible effect size (d = 9.4e-6). IAP-overlapping bins are not different from genome-wide average in H3.3 WT (p = 0.97), but significantly different (p < 2.2e-16) in H3.3 KO. Data shown from n = 1 biological replicate. Source data are provided as a Source data file. d Scatter plot of 5 kb bins, showing H3K9me3 level versus log2-fold change in ATAC-Seq signal upon H3.3 knockout. Bins overlapping with IAP ERVs are drawn in green. e Average coverage of ATAC-Seq signal over 2640 shared IAP ERVs in H3.3 wildtype (WT) and knockout (KO) cell lines. Fragments defined by paired-end reads were piled up and normalized to 1x Genome coverage (Fragments Per Genomic Content, FPGC). f Density heatmaps and average profiles of ATAC-Seq signal using only uniquely mappable reads, over 2640 shared IAP ERVs and flanking regions. See Supplementary Fig. 7e for quantitative analysis and Supplementary Fig. 9 for further comparison with H3.3 and H3K9me3 ChIP profiles. g Average coverage (FPGC) of ATAC-Seq signal (top) and H3.3-SNAP ChIP using only uniquely mappable reads, over 651 IAP solo LTRs (mostly IAPLTR2). Source data are provided as a Source data file.

