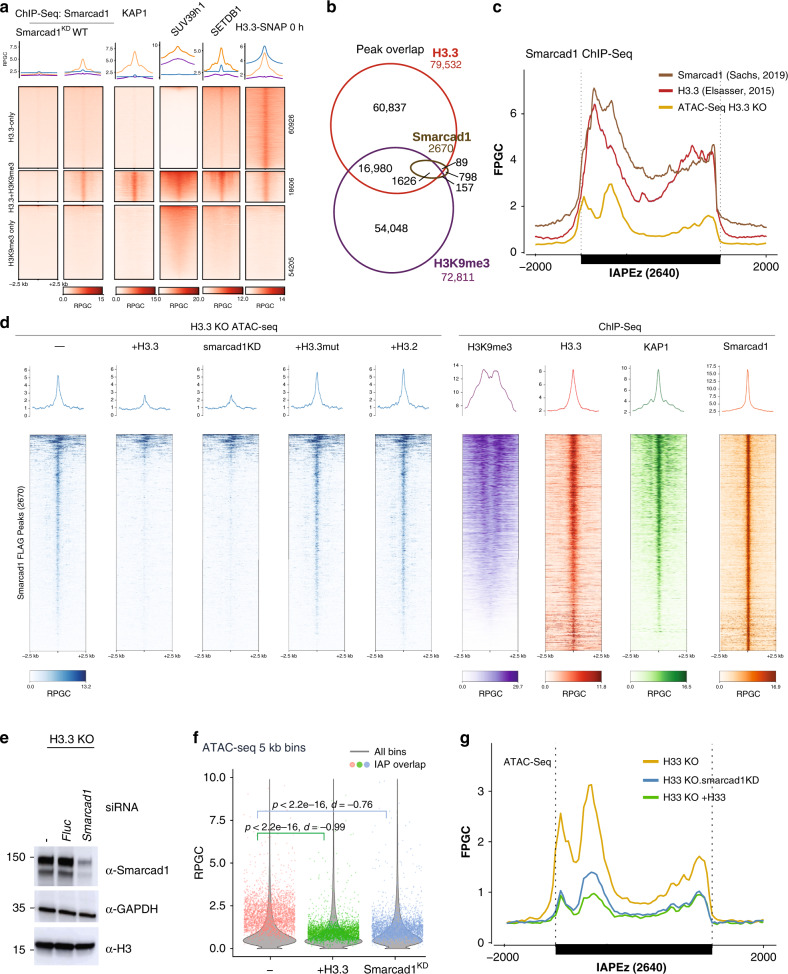
Fig. 5. Smarcad1 chromatin remodeler evicts nucleosomes from interstitial heterochromatin.
a ChIP-Seq density heatmaps and average profiles of Smarcad1 in mouse ESC47 including Smarcad1 knockdown control, KAP171, SETDB173, Suv39h174, and H3.3-SNAP9 over H3.3-only, H3K9me3-only and H3.3 + H3K9me3 peaks21. All data is normalized to Reads Per Genomic Content (RPGC). b Venn diagram showing overlap of Smarcad1 peaks (called from Smarcad1 and Smarcad1-FLAG ChIP-Seq47) with H3.3 and H3K9me3 peaks21. c Average coverage of Smarcad147 and H3.321 ChIP-Seq, as well as ATAC-Seq, over 2640 shared IAP ERVs. Fragments defined by paired-end reads were piled up and normalized to 1x Genome coverage (Fragments Per Genomic Content, FPGC). d ATAC-Seq and ChIP-Seq read density heatmaps and average profiles over 2670 Smarcad1 peaks. ATAC-Seq coverage in H3.3 KO cells and H3.3 KO cells complemented with wildtype H3.3, H3.2 or H3.3LI>AA is shown. Further, H3.3 KO cells were treated with siRNA for Smarcad1 (Smarcad1KD). ChIP-Seq profiles for H3K9me371, H3.321, KAP171, Smarcad147 are shown. Additional control heatmaps are shown in Supplementary Fig. 11. e Western blot showing control and Smarcad1 siRNA treatment of H3.3 KO cell line. Representative image of n = 3 independent experiments. f Violin plots showing genome-wide distribution of ATAC-Seq signal in 5 kb bins, in H3.3 KO cell lines untreated, complemented with H3.3, or treated with Smarcad1 siRNA (Smarcad1KD). Overlayed in color are 2797 individual bins overlapping with 2640 shared IAP ERVs. Two-sided Wilcoxon rank test p value and Cohen’s effect size d are given as compared against an untreated H3.3 KO cell line. Data shown from n = 1 biological replicate. Source data are provided as a Source Data file. g ATAC-Seq average coverage (FPRC) over 2640 shared IAP ERVs for H3.3 KO cell lines untreated, complemented with H3.3, or treated with Smarcad1 siRNA. The second replicate of this experiment is shown in Supplementary Fig. 12.

