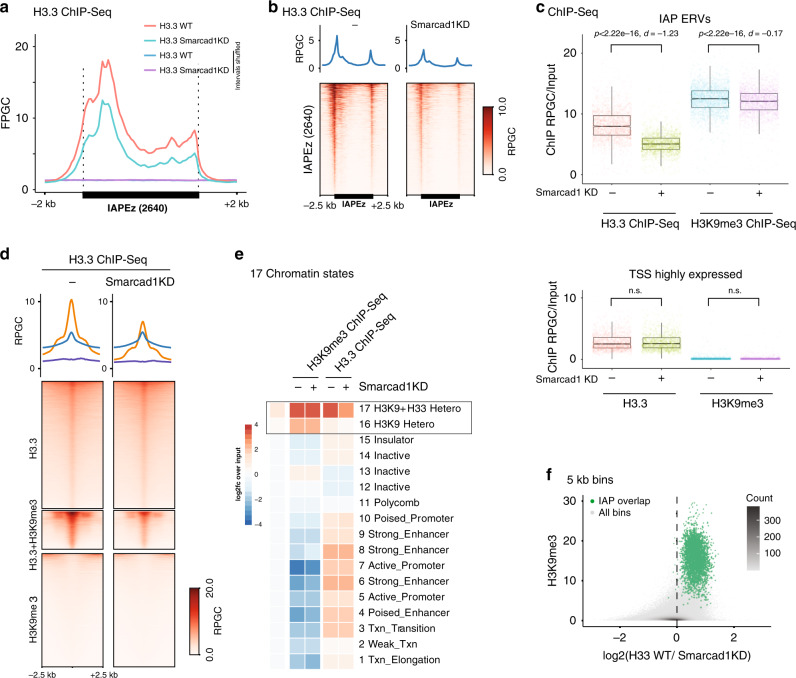
Fig. 6. Smarcad1 drives nucleosome turnover and H3.3 incorporation at interstitial heterochromatin.
a Average coverage of H3.3 ChIP-Seq in H3.3 WT mESC, with or without 48 h Smarcad1 knockdown, over IAP ERVs or random control regions. Fragments defined by paired-end reads were piled up and normalized to 1x Genome coverage (Fragments Per Genomic Content, FPGC). b Density heatmaps and average profiles of ATAC-Seq signal using only uniquely mappable reads, over 2640 shared IAP ERVs and flanking regions. c Boxplots showing H3.3 and H3K9me3 ChIP-Seq density at 2640 shared IAP ERVs (top) or 2024 transcription start sites (TSS) of highly transcribed genes (bottom). Tukey-style center (median), box (first and third quartiles) and whiskers (the maximal 1.5x IQR range). Two-sided Paired T test p value and Cohen’s effect size d are given for each pairwise comparison. Data shown from n = 1 biological replicate. Source data are provided as a Source Data file. d ChIP-Seq density heatmaps and average profiles of H3.3 in H3.3 WT mESC with or without 48 h Smarcad1 knockdown over H3.3-only, H3K9me3-only, and H3.3 + H3K9me3 peaks21. e Mean ChIP-Seq read density heatmap showing enrichments of Smarcad1-FLAG47, H3K9me3, and H3.3 over 15 ChromHMM states37 as well as H3K9me3 and H3.3 + H3K9me3 enriched regions21. Source data are provided as a Source data file. f Density scatter plot of 5 kb bins, showing H3K9me3 level versus log2-fold change in H3.3 enrichment upon Smarcad1 knockdown. Bins overlapping with IAP ERVs are drawn in green. Source data are provided as a Source data file.

