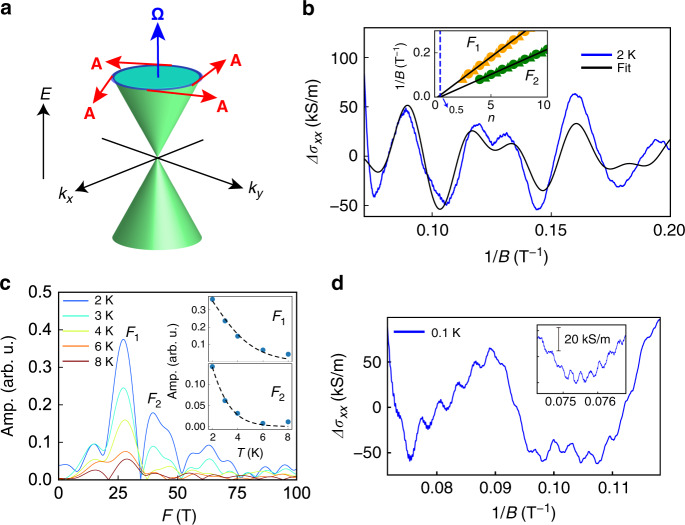
Fig. 3. Quantum oscillations of SrRuO3.
a Schematic image of energy dispersion near a Weyl point. Blue and red arrows represent the Berry curvature Ω and the Berry connection A, respectively. The π Berry phase is accumulated along the cyclotron orbits (blue circle). b SdH oscillation measured at 2 K with B (5 T < B < 14 T) applied in the out-of-plane [001] direction of the SrTiO3 substrate for the SrRuO3 film with the RRR of 84.3. Black curve is the fitting curve of Eq. (1). The fitting was carried out by a nonlinear least squares method with the fitting parameters A1, β1, TD1, A2, β2, and TD2. The inset shows fan diagrams of two oscillation components of F1 (=26 T) and F2 (=44 T), which are shown as orange and green symbols, respectively. Here, the circles and triangles indicate integer and half-integer indexes of the oscillation components. c Fourier transform spectra of the SdH oscillations at 2–8 K. Insets in c show the mass estimations of the F1 and F2 orbits according to the LK theory. Black dashed curves are the fitting curves. d SdH oscillation observed at 0.1 K for the SrRuO3 film with the RRR of 84.3. The inset in d shows a close-up at around 0.075 T−1. The oscillation holds four kinds of other trivial orbits with higher frequencies.

