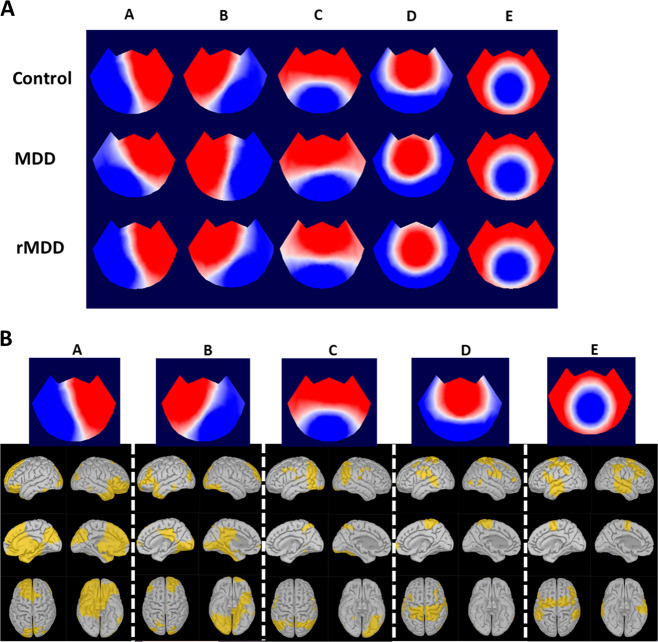
Fig. 1. All three groups produced similar sets of microstates which involve distinct but overlapping, cortical correlates.
a EEG topoplots of microstate topographies obtained independently from the HC, MDD, and rMDD groups. Blue regions are negative and red are positive relative to average reference. Note that microstates are polarity invariant. These microstates are qualitatively similar across groups and include the canonical microstates A–D. b Top row shows the EEG topoplots for the microstates identified in the HC group. Below each microstate is a set of cortical source-localized maps indicating which voxels (yellow) were most strongly associated with the particular microstate.

