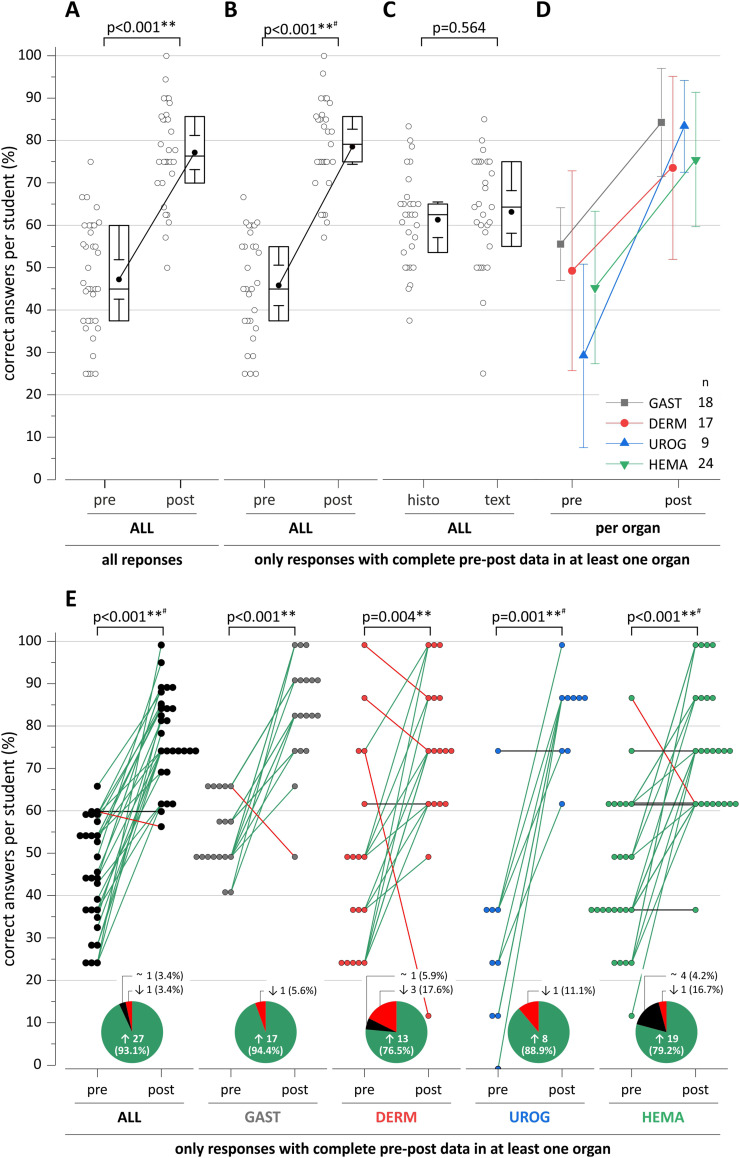
Figure 2.
Data analysis of student-based results. (A) Pre-post-analysis of the percentage of correct answers including all available results (ie including cases where individual students participated in either pre- (n=35) or post- (n=30) evaluation). (B) Same as A, but only including students with complete pre- and post-answers (n=29) in one or more organs. All subsequent figures and analysis contain only “complete data sets”, ie data from students having participated in both, pre- and post-evaluation by Kahoot! in one or more organs. (C) Comparison of % correct answers between histology- and text-based Kahoot! questions. (D) Comparison of the percentage of correct answers pre and post-lecture for each individual topic (mean ± standard deviation). (E) Analysis of pre/post results on the students’ level. Each participating student is represented by a filled circle that is connected by straight lines between pre and post status: students with improved, stable or worse results are indicated by green, black and red lines, respectively. The pie chart inserts show the proportion of students (for all respective the individual topics) and how their results (percentage of correct answers) have changed pre and post-lecture. Differences between groups were calculated by t-tests (for normally distributed data) or Mann–Whitney-tests in case of data without normal distribution (indicated by #); **Indicates p<0.01.

