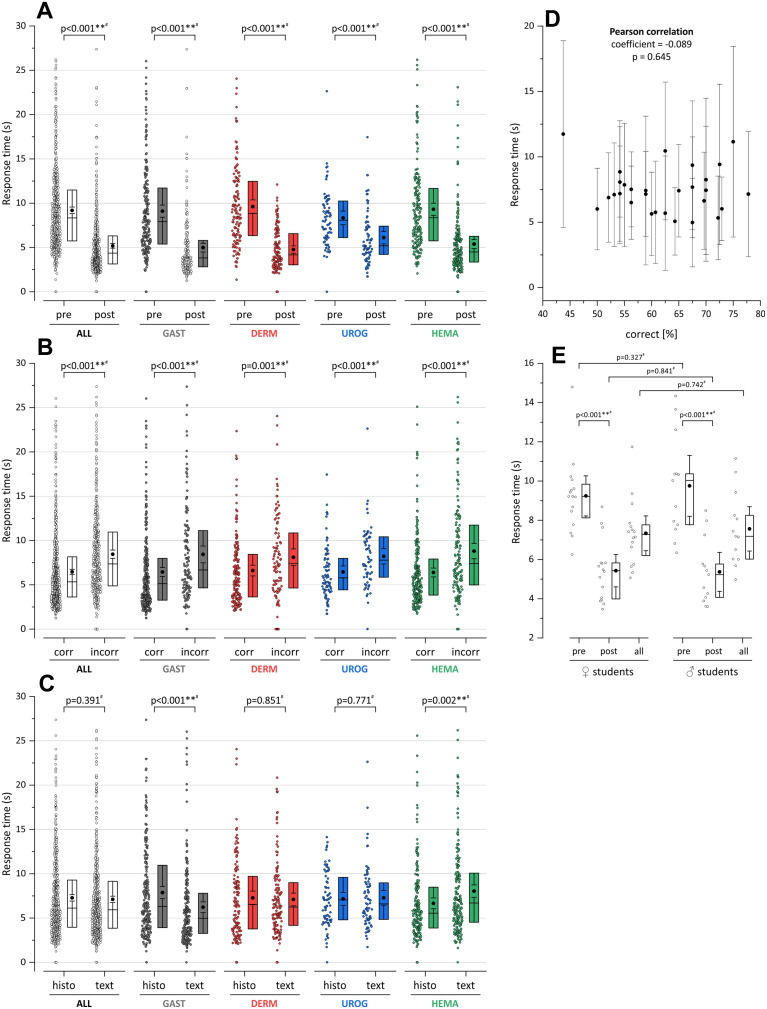
Figure 3.
Analysis of the Kahoot! response time per student. (A) The response time for the individual topics and for all topics together (“ALL”) is compared pre and post-lecture. (B) Correct and incorrect answers are compared. (C) Histology- and text-based questions are compared. (D) Correlation analysis of response time (y-axis) versus percentage of correct answers. (E) Comparison between female and male students regarding pre, post and overall response time. Box plots show the mean (filled circle), median (horizontal line), 25/75% quartiles (box) and the 95 confidence interval (whiskers). Differences between groups were calculated by t-tests (for normally distributed data) or Mann–Whitney-tests in case of data without normal distribution (indicated by #); **Indicates p<0.01.

