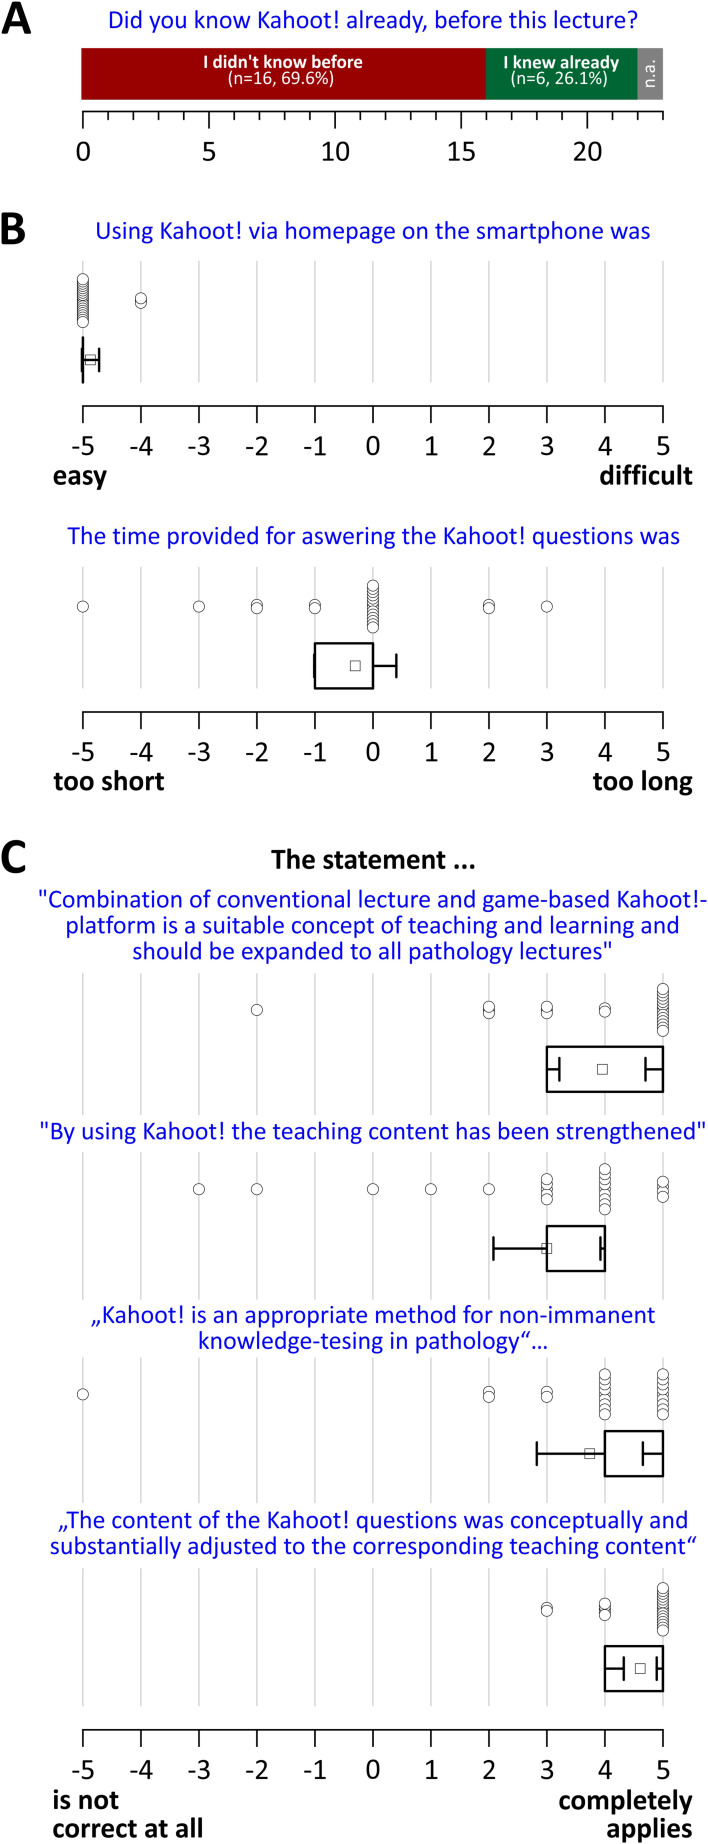
Figure 5.
Student’s evaluation of the Kahoot!-supplemented pathology education. (A) Number and percentage of students who knew (or did not know) Kahoot! before this project. (B) Usability of the chosen Kahoot! settings. (C) Student’s answers on suitability, practicability and design of the Kahoot!-supplemented pathology lectures. Box plots show the mean (filled circle), median (horizontal line), 25/75% quartiles (box) and the 95 confidence interval (whiskers).

