Fig. 3.
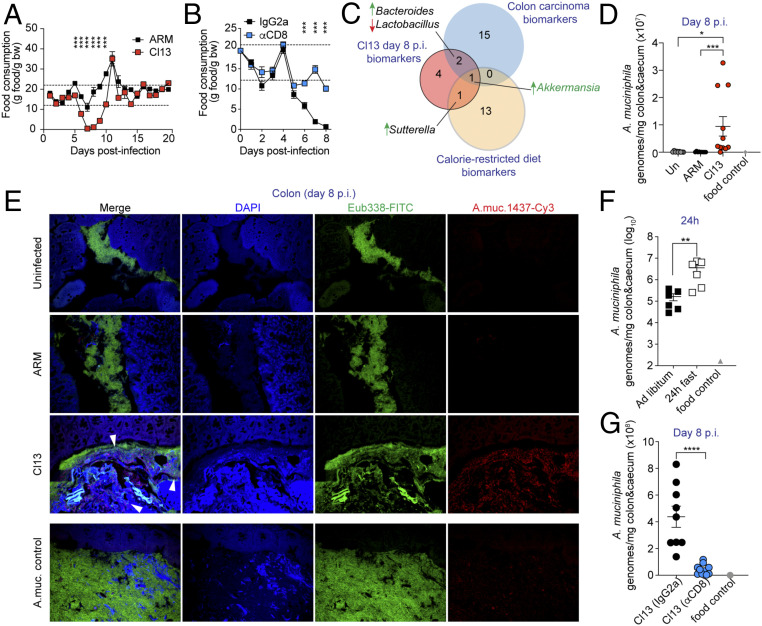
CD8 T cell-driven anorexia is associated with a fasting-related microbiome, including natural blooming of A. muciniphila, early after LCMV Cl13 infection. See also SI Appendix, Figs. S3 and S4 and Dataset S6. C57BL/6 mice were infected with LCMV ARM, Cl13, or left uninfected (Un) (A, D, and E) or infected with LCMV Cl13 and injected i.p. with isotype control (IgG2a) or CD8-depleting antibodies (αCD8) (B and G). (A and B) Grams (g) of food consumed per gram of body weight (bw) over time in indicated groups. Dotted lines mark the healthy range of food consumption determined in uninfected mice as described in SI Appendix, Materials and Methods. (C) Taxa overlap of Cl13 d 8 p.i. biomarkers defined as in Fig. 1E (red), mouse colon carcinoma biomarkers defined by linear discriminant analysis effect size in ref. 80 of mice s.c. transplanted with colon cancer cells (blue), as reported in ref. 35 and caloric restriction biomarkers defined after MR analysis with Songbird of the stools of mice after 3 wk on a calorie-restricted diet, from a previous study (37) (yellow). (D, F, and G) Absolute A. muciniphila genomes in colonic and caecal contents were quantified by qPCR in uninfected mice or mice infected with LCMV ARM or Cl13 at day 8 p.i. (D), in uninfected mice fed ad libitum, or fasted for 24 h (F) and in Cl13-infected mice treated with CD8-depleting or isotype control antibodies (G). DNA from a food pellet was used as a negative control (food control). (E) FISH images with Eubacteria (Eub338, green) or A. muciniphila (A.muc.1437, red)-specific probes on colon sections from Un, ARM-, and Cl13-infected mice at day 8 p.i. One uninfected mouse was intraorally (i.o.) inoculated with ∼1.2 × 10⁸ cfu of live A. muciniphila 24 h prior to necropsy and used as positive control (A.muc. control). (A, B, D, F, and G) averages ± SEM. Data are representative of one out of three (A and B), two (E and G), or pooled from two (F) or three (D) independent experiments with n = 3 to 10 mice/group. (A and B) Unpaired two-tailed Student’s t test per time point, (F and G) Mann–Whitney test, (D) one-way ANOVA with Tukey’s correction; *p-val < 0.05, **<0.01, ***<0.001, ****<0.0001.

