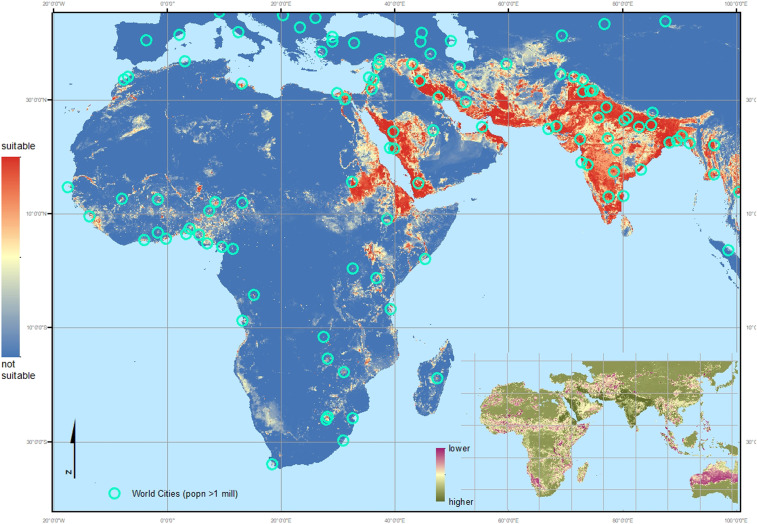
Fig. 3.
Inclusive map: Environmental suitability map of An. stephensi using the updated occurrence database including all African sites. Red indicates a higher probability of environmental suitability whereas the blue indicates environments with a lower probability, i.e., more likely to be unsuitable for the species to occur. The environmental variables selected by the model as relevant to An. stephensi habitat suitability, in descending order (based on correlation score): Ann. Mean Temp. = 0.461, Human Popn Dens. = 0.370, EVI = 0.174, Precip (season) = 0.161, TCW = 0.134, Irrigation= 0.130, Crop mosaic = 0.010. Turquoise circles indicate the location of cities with a population > 1 million. The thumbnail map shows the coefficient of variation calculated per pixel across the predicted range, indicating where the ensemble model provides the most reliable (higher confidence: dark green) and least reliable (lower confidence: red) predictions.

