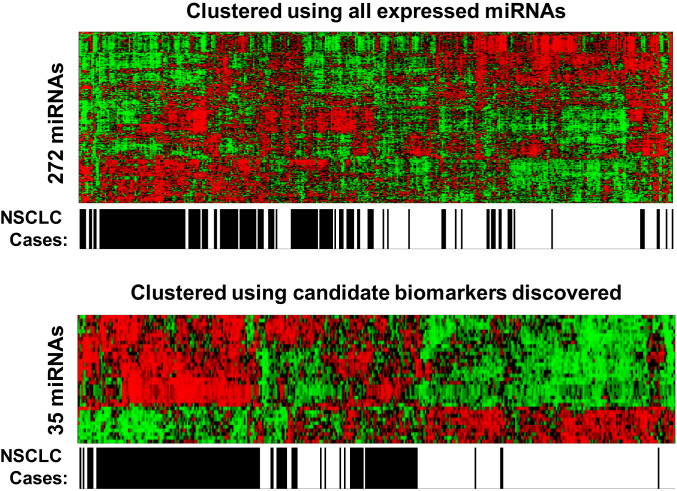
Fig. 1.
Candidate biomarkers segregate NSCLC cases from noncancer controls. Heatmap of normalized miRNA expression levels following unsupervised hierarchical clustering of all 424 subjects in the discovery cohort using 272 expressed miRNAs (Upper) and 35 candidate biomarkers (Lower).The horizontal axis represents the NSCLC status for the samples, with black color for NSCLC subjects and white color for non-NSCLC control subjects. The heatmap shows relative miRNA expression level with red indicating higher expression and green indicate lower expression.

