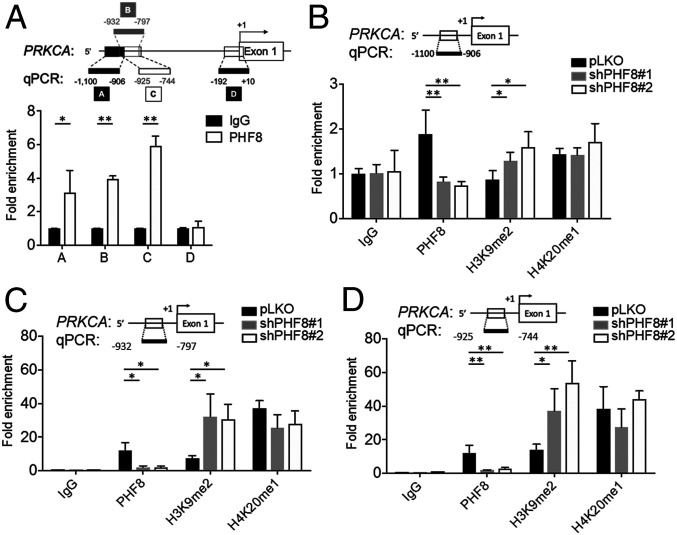
Fig. 3.
Analysis of PHF8 occupancy in the promoter region of PRKCA. (A) ChIP analysis of PHF8 enrichment in the promoter region of PRKCA with four sets of primers as indicated. IgG as a control. (B−D) Fold enrichment of PHF8, H3K9me2, and H4K20me1 on the PRKCA promoter in pLKO and shPHF8 (#1 and #2) MKN28 across three regions [−1,100 to −906 (B), −932 to −797 (C), and −925 to −744 (D)]. In A−D, data are presented as the average of three replicates ± SD *P < 0.05, **P < 0.01 (two-tailed Student's t test).

