Fig. 2.
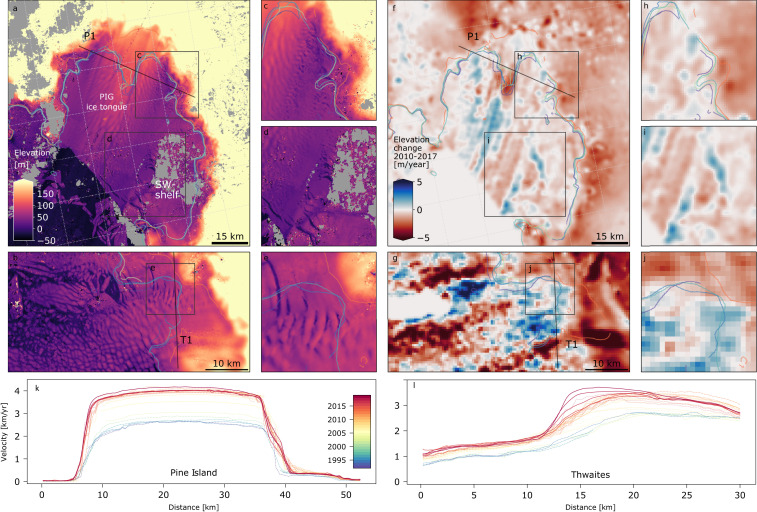
Elevation and thinning rates over PIG area. (A–E) ASTER satellite digital elevation model from January and February 2018 showing the elevation of PIG (A, C, and D) and TG (B and E) ice shelves and the damage areas in the thinner areas. Gray values are masked no data values. Zoom boxes, transects [P1, T1], and grounding line evolution since 1992 (40) are illustrated in black and spectral colors, respectively (see Fig. 1). (F–J) Elevation changes (2010 to 2017) derived from Cryosat-2 satellite altimetry data showing thinning over the PIG and TG glaciers and ice shelves in combination with the local advection of patches of thicker ice. (H–J) Zoom areas corresponding to boxes in F and G. (K) Velocity transects along transect P1 derived from multisource satellite imagery since 1992, where the colors represent the different observation years and the line types show different datasets. (L) Same as K but along transect T1 (Fig. 1A).

