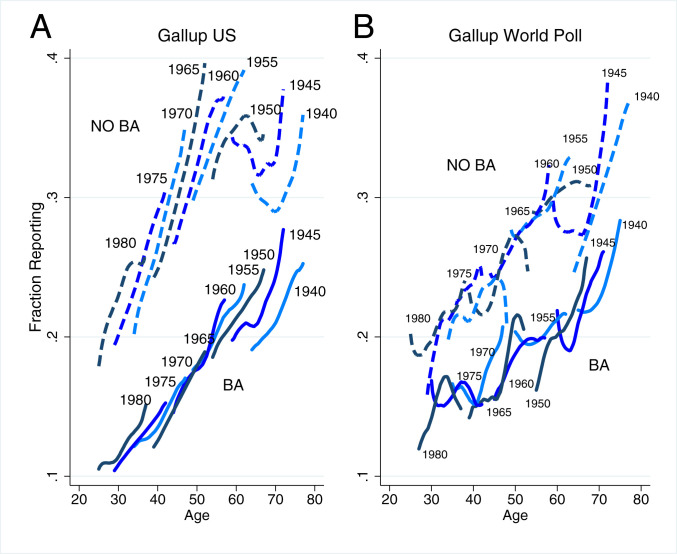
Fig. 3.
Pain by education and birth cohort in Gallup US and Gallup World Poll data. A plots reports of pain by age in the United States for every 5-y birth cohort from those born 1940–1944 through those born 1980–1984. Plots are drawn separately for those with and without a BA, using the Gallup Health and Wellbeing Index. B plots reports of pain in other wealthy countries analogously using the Gallup World Poll.

