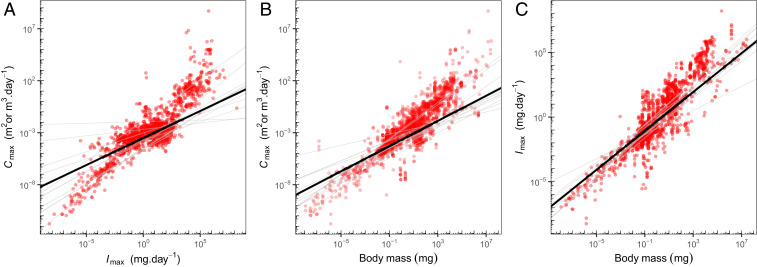
Fig. 2.
Relationships between Cmax, Imax, and body mass. Cmax and Imax are strongly positively associated (A) (marginal R2 = 72%, conditional R2 = 96%), but this relationship reflects their strong dependence on body mass (B and C) (marginal R2 = 64 and 72%, conditional R2 = 94 and 92%, for Cmax and Imax, respectively). The size dependence of both traits is close to isometric based on OLS regression, but accounting for nonindependence with random effects for species and taxonomic group identity reduces the slopes to 0.75 for Imax and 0.6 for Cmax. Black lines represent across-group patterns captured in the models by fixed effects, while gray lines represent phylum-level variation captured with random slopes and intercepts. Species-level variation is also captured by random intercepts. Variation in the relationships across environments (aquatic/terrestrial) and feeding dimension (surface/volume feeders) is minimal, and is shown in SI Appendix, Fig. S1.

