Fig. 2.
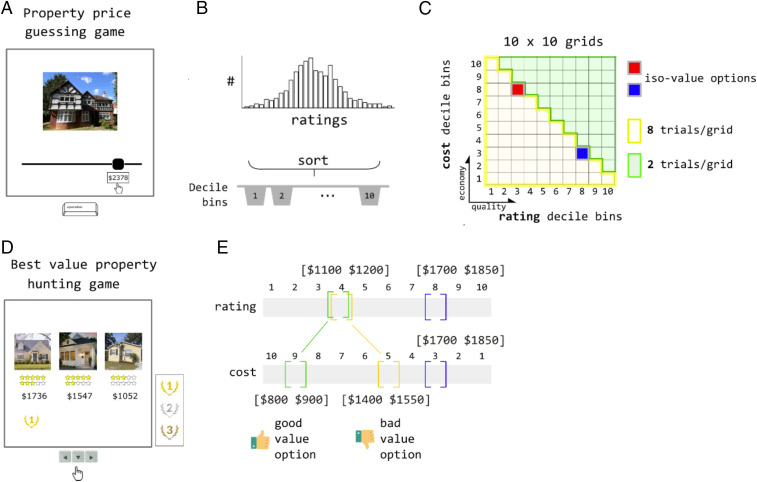
Task and analysis pipeline. (A) Participants first played a “property price guessing game.” On each trial, they estimated the monthly rental value (in dollars) of a residential property, using a sliding scale. (B) After discarding properties with inconsistent responses, ratings were sorted into deciles for each participant. (C) These bins were used to select stimuli for targets A and B (deciles 3 and 8 of estimated ratings; red and blue squares), and decoy stimuli. Each choice task stimulus was created by matching a property with a given decile estimated value (quality; attribute ) to a new rental price (economy; attribute ) on a 10 × 10 grid. Eight property/price combinations were generated for each cell in the grid that lies below the diagonal (yellow cells), and two property/price combinations were generated for each cell above the diagonal (green cells). (D) Participants then played a “best value property hunting game” in which they were asked to rank three stimuli according to their economy/quality trade-off. A star rating system was used as a reminder of their previous price estimation judgment. (E) Illustration of how the initial rating and cost were paired to create good value options (above the diagonal; green), poor value options (below the diagonal, yellow), and iso-valued options (here a target option; blue).

