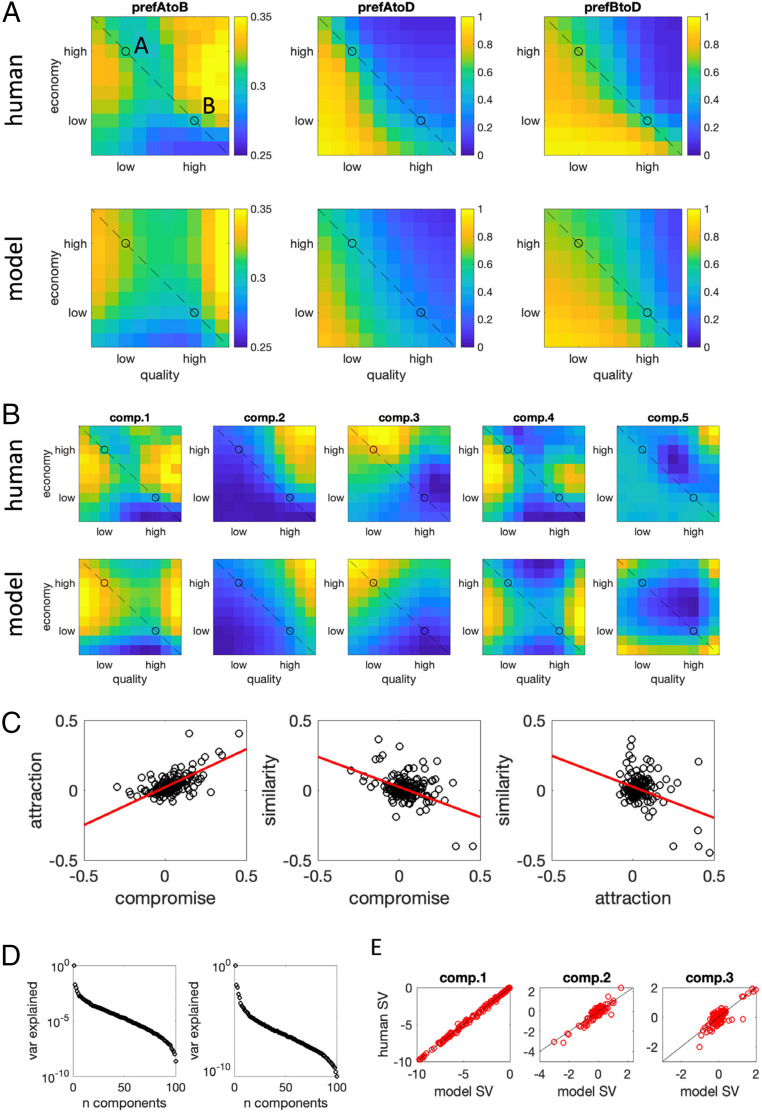
Fig. 3.
(A) Decoy influence map showing for A over B (Left), A over D (Middle), and B over D (Right). (Top) The human data and (Bottom) the same data for the simulated model. The dashed line signals iso-preference, and the black circles are the targets A and B. (B) First five components obtained from SVD of the RCS for A vs. B. (Top) The human data and (Bottom) the model. (C) Correlations between the attraction, compromise, and similarity effects. Each dot is a single participant, red lines illustrate best linear fit; the decoy estimate is calculated as the difference between the RCS for given decoy with respect to targets A and B. (D) The variance (var) explained by each component obtained by SVD for (Left) the humans and (Right) the model. Note that the y axis is on a log scale; the data are dominated by the first component in both cases. (E) Correlation between singular values (SV) for components 1 to 3 between the human and the best-fitting model; each dot is a single participant, black lines illustrate best linear fit . For components 1 to 3, this correlation was very high.

