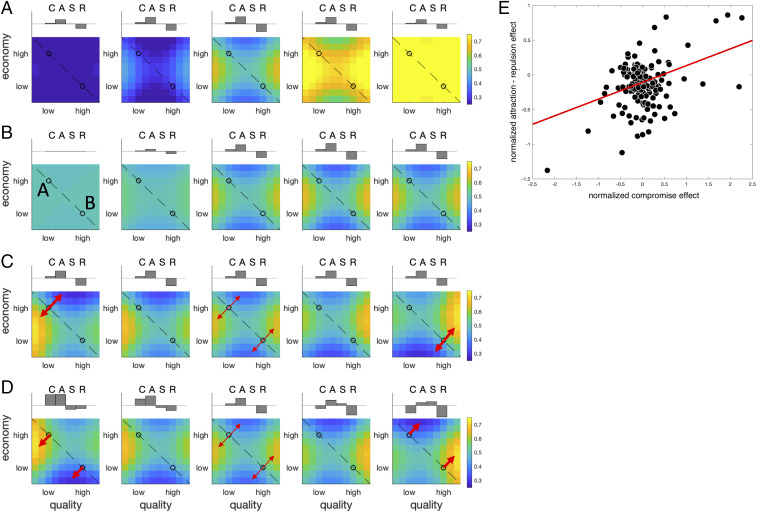
Fig. 4.
(A) Effect of varying the parameter from low (Left) to high (Right). The parameters used to generate each plot are shown in SI Appendix, Table S1. This parameter controls the relative preference for low price/quality to high price/quality items. (B) The effect of varying the parameter from high to low. This parameter controls whether A and B are equally preferred, or whether there is decoy-like distortion. (C) The effect of varying the difference of bias terms from negative (Left) to positive (Right). Varying this difference alters whether the maximal distortion occurs proximal to target A (Left) or target B (Right). (D) The effect of varying the sum of bias terms from negative (Left) to positive (Right). Varying this difference alters whether the maximal distortion occurs for inferior decoys (Left) or superior decoys (Right). Red arrows in C and D highlight directions of repulsion, with arrow width schematically representing the strength of the effect. The dashed line in A–D signals iso-preference, and the black circles are the targets A and B. (E) Correlation between the compromise effect and the relative strength of attraction vs. repulsion in the human data. Each dot is a participant; the red line is the best fitting linear trend.

