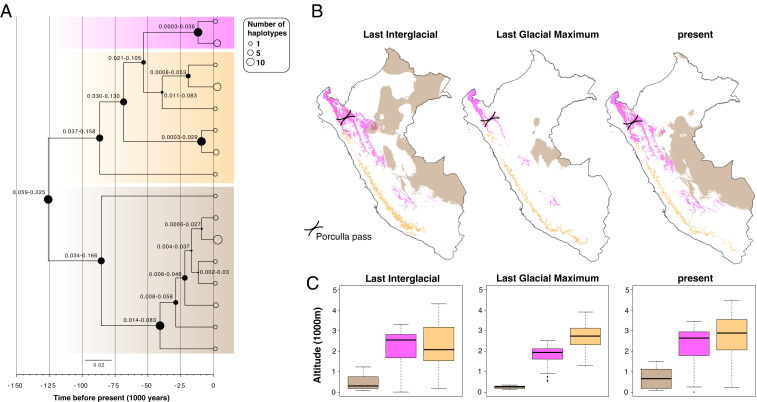
Fig. 2.
(A) Time-calibrated phylogenetic tree for the L. braziliensis species complex based on maxicircle gene alignments. At each node, the size of the filled circles reflects the posterior density ranging between 0.15 and 1, while the numbers represent the 95% highest posterior density of the divergence time estimates. Thick transparent boxes mark the maxicircle haplotypes of L. braziliensis (brown), L. peruviana Porculla (magenta), and L. peruviana Surco (orange). The sizes of the open circles at the tips of the branches reflect the number of haplotype sequences (legend on the top right). (B) Geographic maps of Peru showing the modeled distribution and (C) average altitude of the predicted habitat patches, for each of the three major Leishmania lineages during the LIG, LGM, and present (see A for color codes).

