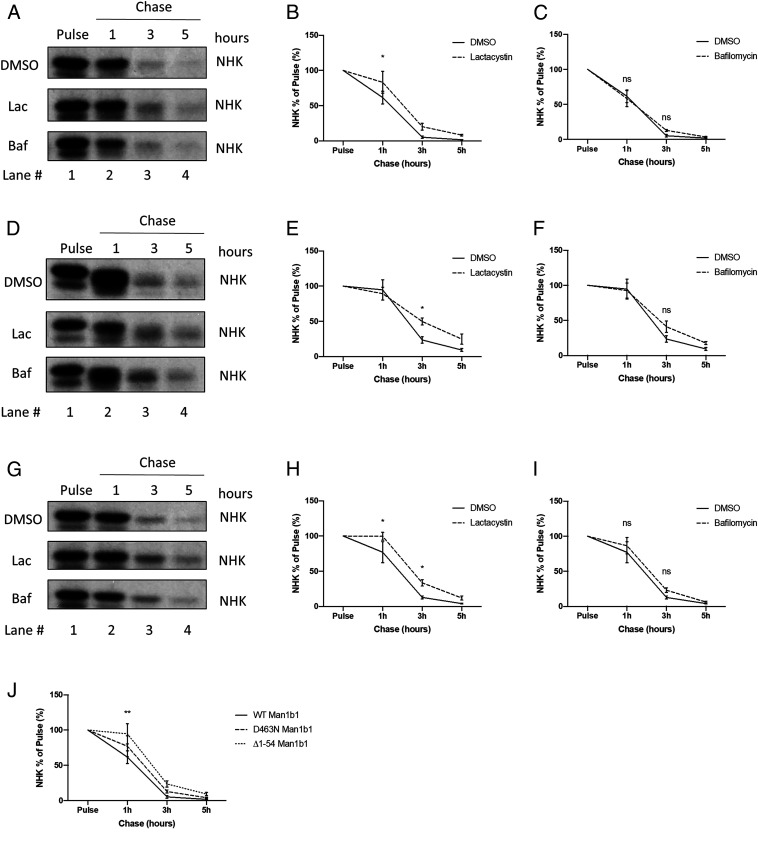
Fig. 6.
Proteasomal degradation functions as a common endpoint for the conventional and unconventional intracellular degradation of NHK promoted by Man1b1. (A) 35S metabolic pulse-chase radiolabeling analyses of 293T E7 cells transfected with NHK and WT Man1b1 constructs. At 12 h posttransfection, cells were treated with DMSO, lactacystin, or bafilomycin for 12 h. Cells were then labeled for 15 min with [35S]methionine and [35S]cysteine, then chased at 1 h, 3 h, and 5 h with the same inhibitor treatments present in the media. The gels shown are representative of three independent experiments. (B and C) Graphic representations of NHK levels in pulse-chase experiments shown in A. Data are reported as the mean ± SEM with statistical significance calculated by two-way ANOVA and Dunnett’s multiple comparisons test. ns, not significant. *P ≤ 0.05, n = 3. (B) Comparison between DMSO and lactacystin groups from A. (C) Comparison between DMSO and bafilomycin groups from A. (D) 35S metabolic pulse-chase radiolabeling analyses of 293T E7 cells transfected with NHK and ∆1 to 54 Man1b1 constructs in a parallel setting as shown in A. (E and F) Graphic representations of NHK levels in pulse-chase experiments shown in D. Data are reported as the mean ± SEM with statistical significance calculated by two-way ANOVA and Dunnett’s multiple comparisons test. ns, not significant. *P ≤ 0.05, n = 3. (E) Comparison between DMSO and lactacystin groups from D. (F) Comparison between DMSO and bafilomycin groups from D. (G) 35S metabolic pulse-chase radiolabeling analyses of 293T E7 cells transfected with NHK and D463N Man1b1 constructs in a parallel setting as shown in A. (H and I) Graphic representations of NHK levels in pulse-chase experiments shown in G. Data are reported as the mean ± SEM with statistical significance calculated by two-way ANOVA and Dunnett’s multiple comparisons test. ns, not significant. *P ≤ 0.05, n = 3. (H) Comparison between DMSO and lactacystin groups from G. (I) Comparison between DMSO and bafilomycin groups from G. (J) Graphic representations of NHK levels in DMSO-treated samples from the 35S metabolic pulse-chase experiments shown in A, D, and G. Data are reported as the mean ± SEM with statistical significance calculated by two-way ANOVA and Tukey’s multiple comparisons test. **P ≤ 0.01 (between WT and ∆1 to 54 Man1b1 samples at 1-h timepoint), n = 3.

