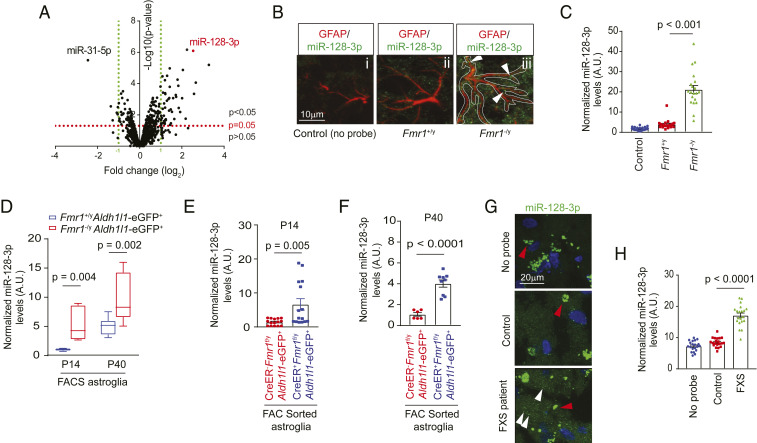
Fig. 1.
Cell-autonomous up-regulation of miR-128-3p in FMRP-deficient astroglia. (A) Volcano plot of differentially expressed miRs between cultured Fmr1+/y and Fmr1−/y astroglia by miR microarray. n = 3 biological samples per condition. miRs with expression values <23 arbitrary units (A.U.) from the microarray were deemed not expressed. Representative images (B) and quantification (C) of astroglial miR-128-3p expression levels by in situ hybridization in the somatosensory cortex from Fmr1+/y and Fmr1−/y mice at P14. GFAP immunoreactivity was used as a guide to determine astroglial domains for quantifying miR-128 intensity in astroglia. (Scale bar, 10 μm.) White arrows indicate miR-128-3p signal within astroglia. n = 20 individual astroglia/3 mice per condition. P values were determined using one-way ANOVA and post hoc Tukey’s test. (D) Expression levels of miR-128-3p in FAC sorted cortical astroglia from Fmr1+/yAldh1l1-eGFP+ and Fmr1−/yAldh1l1-eGFP+ mice at P14 or P40. n = 3 to 5 biologically independent samples per condition. The data are presented in the box and whisker plot with defined elements, median (Center line), upper and lower quartiles (bounds of box), and highest and lowest values (whiskers). P values were determined using two-tailed unpaired t test. Expression levels of miR-128 in FAC sorted cortical astroglia from control (Slc1a3-CreERT−Fmr1f/yAldh1l1-eGFP+) and astroglial Fmr1 cKO (Slc1a3-CreERT+Fmr1f/yAldh1l1-eGFP+) mice at P14 (E) or P40 (F). n = 3 to 6 biologically independent samples per condition. P values were determined using two-tailed unpaired t test. Representative images (G) and quantification (H) of miR-128-3p expression by in situ hybridization in cortex from human FXS patients and nonneurological disease controls. n = 20 individual astroglia/2 subjects per condition. White arrows: miR-128-3p signals; red arrows: nonspecific fluorescent signals (>0.7 μm in diameter); P values were determined using one-way ANOVA and post hoc Tukey’s test.

