Fig. 3.
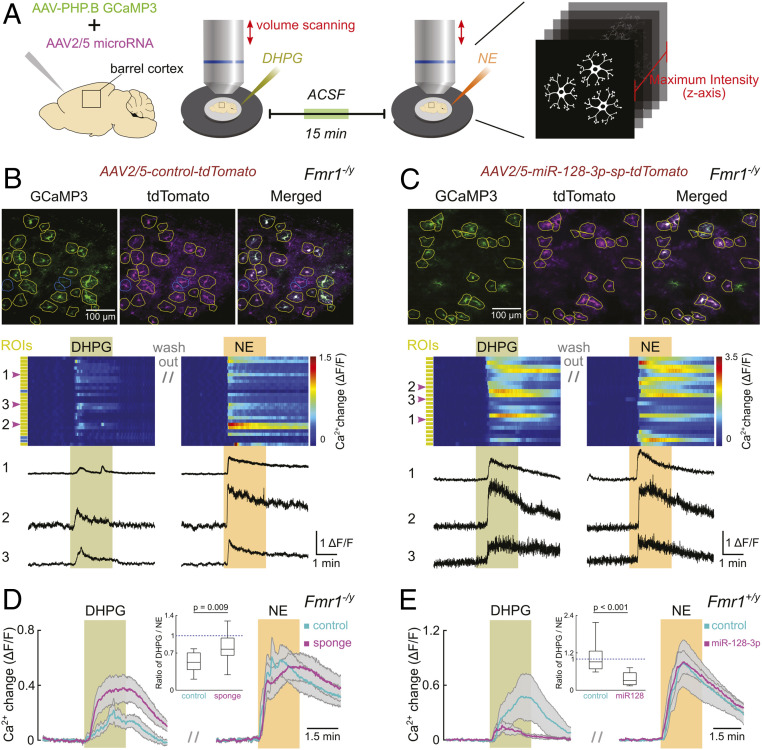
miR-128-3p expression essentially and sufficiently regulates astroglial mGluR5-mediated Ca2+ response in adolescent mice. (A) Graphical representation of the experimental design. Acute slice preparation of mouse barrel cortex was performed on P13 to P16 mice following P0–P1 injection of AAVs. Two-photon volume scanning was applied to compare individual astroglial responsiveness to DHPG and NE. Ca2+ dynamics were quantified following a collapse of volume data into planar data. Upper, representative Ca2+ maximum intensity projection images from Fmr1−/y mouse during exposure to NE; green: astroglial GCaMP3 expression; magenta: expression of AAV-control-tdT (B) or AAV-miR-128-sp-tdT (C). Yellow circles: ROIs of individual tdT+ astroglia responding to NE. Blue circles: ROIs of individual tdT+ astroglia not responding to NE. Middle, pseudocolor plot represents Ca2+ dynamics of individual astroglia following AAV-control-tdT (B) or AAV-miR-128-sp-tdT (C) injections. Yellow or blue rectangles on the side indicate corresponding type of ROI in Upper. Green bar highlights DHPG (50 μM) application; orange bar highlights NE (30 μM) application. Lower, corresponding Ca2+ change traces from representative astroglia marked as 1, 2, and 3. (D) Quantitative analysis of Ca2+ responses from all examined Fmr1−/y mouse astroglia expressing either control (cyan) or miR128-sp (magenta). Each colored trace with the respective gray shading represents mean ± SEM of Ca2+ dynamics of astroglia from all slices. Colored bars indicate application of DHPG and NE, respectively. The Inset boxplot demonstrates the ratio of peak Ca2+ response induced by DHPG to that induced by NE. n = 13 slices (171 astroglia)/3 mice (control) and 13 slices (226 astroglia)/4 mice (sp). (E) Quantitative analysis of Ca2+ responses from all examined Fmr1+/y mouse astroglia expressing either control (cyan) or miR-128-3p (magenta). n = 10 slices (181 astroglia)/3 mice (control) and 10 slices (168 astroglia)/4 mice (miR-128-3p). P values were calculated from the Student’s t test. For Inset plot in D and E, the data are presented in the box and whisker plot with defined elements, median (Center line), upper and lower quartiles (bounds of box), and highest and lowest values (whiskers).

