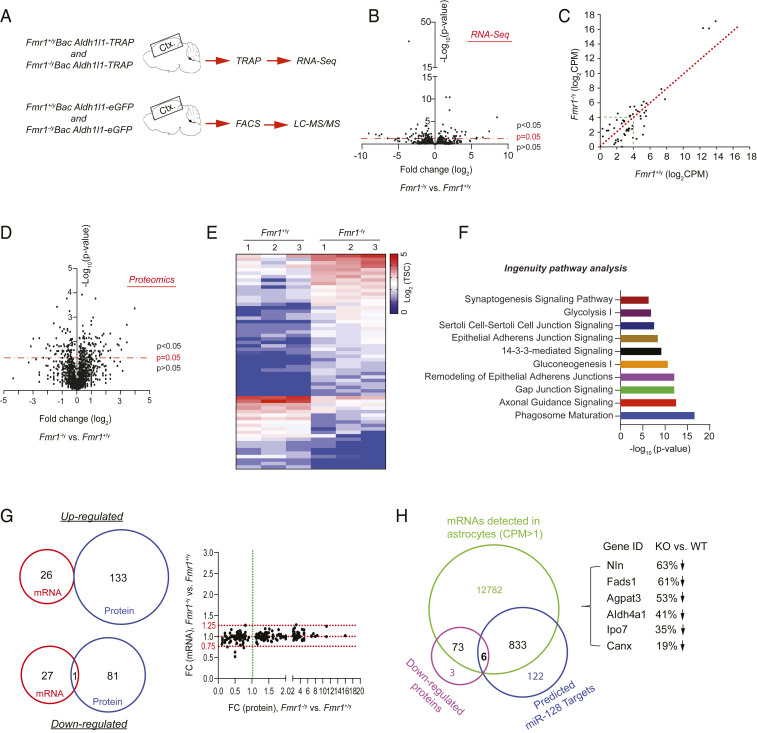
Fig. 4.
Genome-wide profiling of translating mRNAs and proteins in Fmr1+/y and Fmr1−/y cortical astroglia. (A) Schematic diagram of TRAP/RNA-seq and FACS/LC-MS/MS to profile ribosome-bound mRNA and proteomics from cortical astroglia of Bac Aldh1l1-TRAP or Bac Aldh1l1-eGFP mice (P40), respectively. (B) Volcano plot of expressed mRNAs in cortical astroglia identified by TRAP/RNA-seq from Fmr1+/yAldh1l1-TRAP and Fmr1−/yAldh1l1-TRAP mice. n = 3 biologically independent samples per condition; somatosensory cortex sections (1 mm) were used in TRAP isolation. (C) Scatterplot of averaged expression values (log2 cpm) of DEGs between Fmr1+/yAldh1l1-TRAP and Fmr1−/yAldh1l1-TRAP cortical astroglia. (D) Volcano plot of proteins identified by LC-MS/MS from FAC sorted cortical astroglia of Fmr1+/yAldh1l1-eGFP and Fmr1−/yAldh1l1-eGFP mice. n = 3 biologically independent samples per condition. (E) Heatmap of top DEPs (FC >2 fold) between cortical astroglia of Fmr1+/yAldh1l1-eGFP and Fmr1−/yAldh1l1-eGFP mice. TSC: total spectrum counts. (F) Top 10 signal pathways clustered from DEPs using IPA. (G) Essentially no overlap between altered mRNAs and proteins between Fmr1+/y and Fmr1−/y astroglia illustrated by Venn diagrams and scatterplot. Scatterplot shows fold changes of altered proteins and their corresponding mRNAs. (H) Identification of down-regulated proteins in Fmr1−/y astroglia whose mRNAs have predicted miR-128-3p binding sites. Venn diagram showing the number of expressed mRNAs (cpm > 1) and down-regulated proteins, as well as predicted miR-128-3p mRNA targets, respectively. There are six mRNAs having miR-128-3p binding targets and also encoding for proteins that are down-regulated in Fmr1−/y astroglia compared to Fmr1+/y astroglia. These six genes and their protein expression changes in Fmr1−/y vs. Fmr1+/y astroglia are shown.

