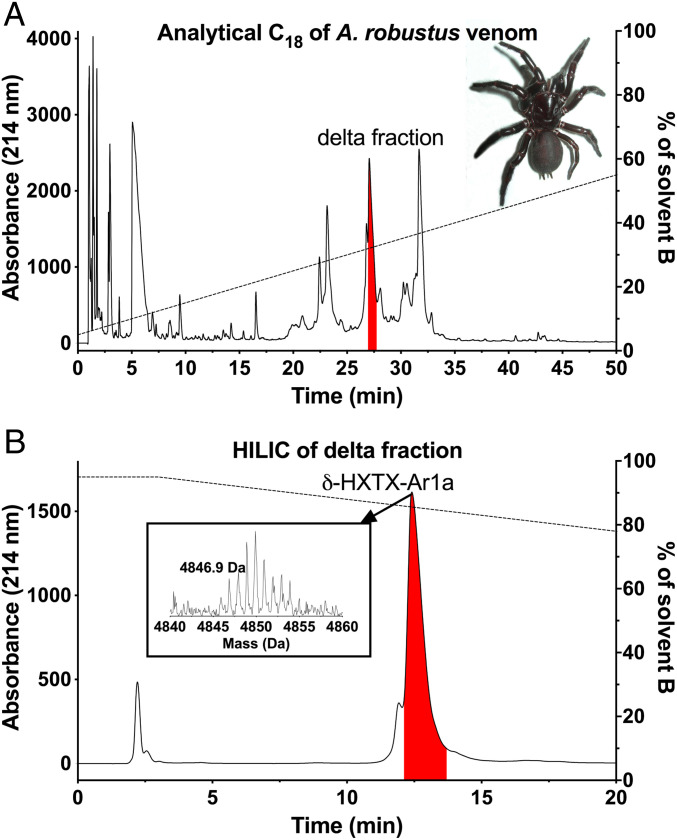
Fig. 4.
Isolation and purification of Ar1a from A. robustus venom. (A) Chromatogram from C18 RP-HPLC fractionation of A. robustus venom with the peak containing Ar1a highlighted in red. (A, Inset) Photo of a female A. robustus. (B) Chromatogram from hydrophobic interaction liquid chromatography (HILIC) of the Ar1a-containing peak from A. The dashed line indicates the solvent gradient, with the percentage of solvent B (90% acetonitrile/0.045% trifluoroacetic acid) indicated on the right ordinate axis. (B, Inset) MALDI-MS spectrum of purified Ar1a.

