Fig. 1.
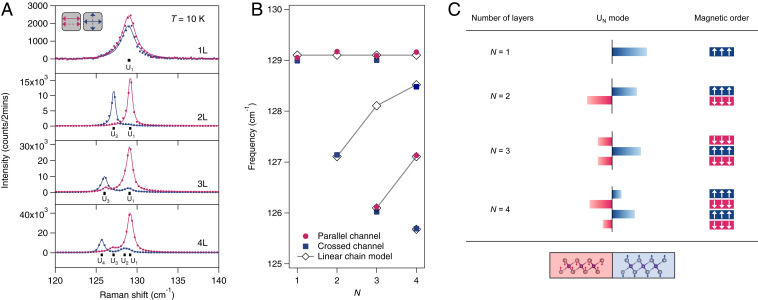
(A) Raman spectra of 1L to 4L CrI3 acquired in linear parallel (red) and crossed (blue) channels at 10 K. The solid curves are fits to the raw data (dots). The vertical bars underneath individual spectra denote the fitted frequencies and (i = 1, …, N) labels the corresponding modes in N-layer CrI3. (B) Plot of the fitted frequencies of the modes in A as a function of layer number N. Red solid circles and blue solid squares correspond to modes extracted from the linear parallel and crossed channels, respectively. Solid curves with open diamonds are fits to the Davydov-split frequencies calculated from the linear chain model. (C) Atomic displacement of the lowest-frequency mode along with the layered-AFM order to illustrate that and share the same parity and that is maximized at i = N. The rectangular bar represents the atomic displacement amplitude and phase for individual layers, by its length and color (red and blue for opposite phase), respectively.

