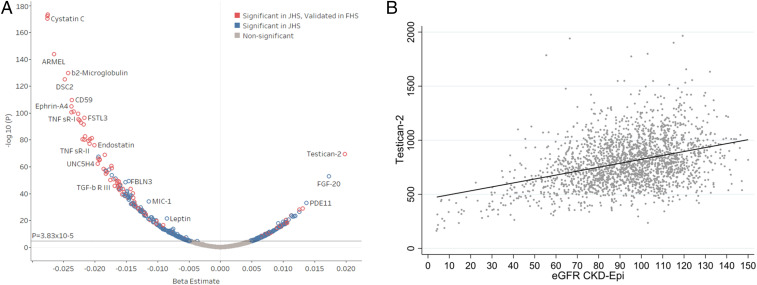
Fig. 2.
Testican-2 has a strong, positive cross-sectional association with eGFR. (A) Volcano plot showing multivariable-adjusted protein associations with baseline eGFR in the JHS and FHS. The blue circles represent Bonferroni significant associations (P < 3.8 × 10⁻⁵) in JHS. The red circles represent proteins found to be significant in both JHS (P < 3.8 × 10⁻⁵) and FHS (P < 1.1 × 10⁻⁴). Models adjusted for age, sex, BMI, diabetes, hypertension, and APOL1 risk status (JHS only). (B) Scatter plot showing cross-sectional relationship between baseline eGFR and testican-2 levels in JHS.

