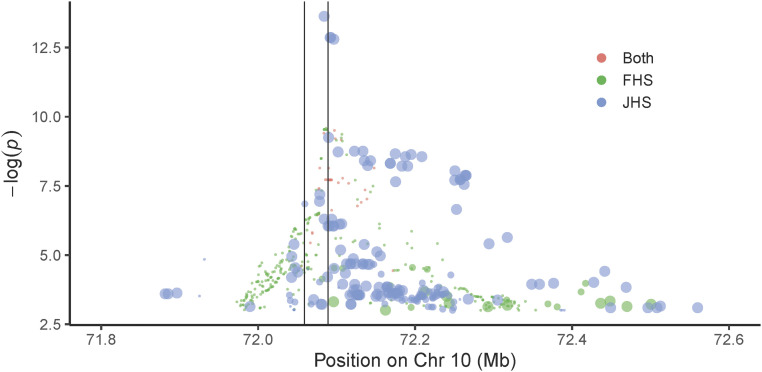
Fig. 4.
SPOCK2 variants are associated with circulating testican-2 levels in JHS and FHS. Modified zoom locus plot where red circles represent variants observed in both JHS and FHS; green circles represent variants observed in FHS only, and blue circles represent variants observed in JHS only. The size of the blue circles indicates the alternate allele frequency in Europeans; the largest circles indicate European MAF < 0.001, the medium circles indicate 0.001 < MAF < 0.05, and small circles indicate MAF ≥ 0.05. These data demonstrate that many JHS variants are not observed in European cohorts. The vertical lines are drawn to indicate the SPOCK2 locus, with transcription running from Right to Left.

