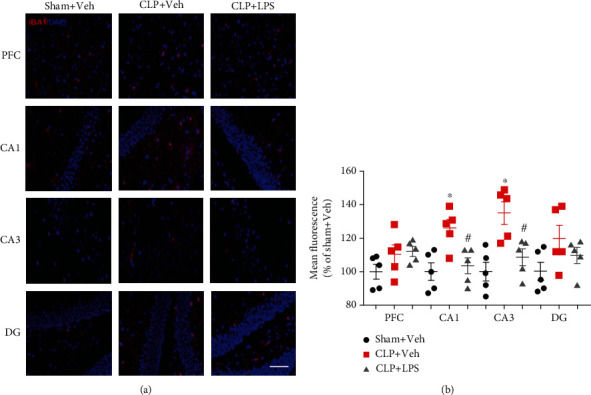
Figure 7.

Effects of repeated LPS injections and CLP on IBA1-positive cells. Immunohistochemistry showed increased intensity of IBA1-positive in the CA1 and CA3 following CLP, which were partially prevented by repeated LPS injections. Data represent mean ± SEM; n = 5/group. ∗P < 0.05 vs. sham + Veh group; #P < 0.05 vs. CLP + Veh group. LPS: lipopolysaccharide; CLP: cecal ligation and puncture; Veh: vehicle; PFC: prefrontal cortex; CA1: cornu ammonis 1; CA3: cornu ammonis 3; DG: dentate gyrus. Red indicates IBA1; blue indicates DAPI; scale bar = 100 μm.
