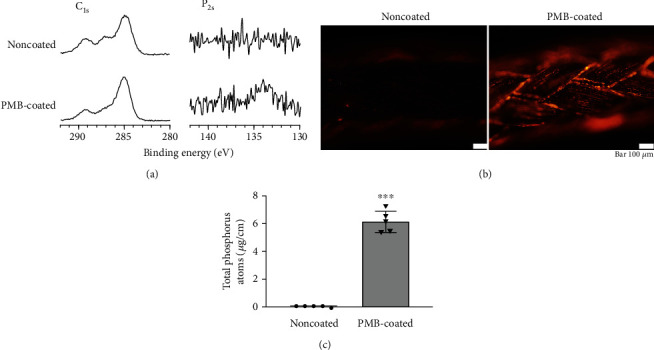
Figure 1.

Analysis of the surface composition of biomaterials. (a) XPS spectra of sutures, C1s, and P2p. (b) Representative fluorescence micrographs of noncoated and PMB-coated sutures stained with rhodamine 6G. The scale bar indicates 100 μm. (c) The absolute amount of phosphorus atoms on suture surfaces. ∗∗∗p < 0.001.
